Hi,
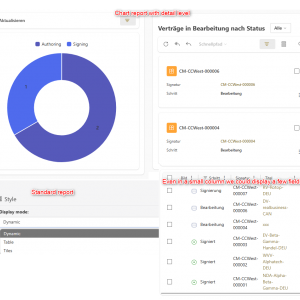
if we have a chart with a detail level, you can click on a chart element to see the elements, these information are displayed as tiles. At least if the chart is located in a row set to "one-third column" and the chart is located in the smaller part.
It would be great if we could also define the display mode of a report for a chart. This display mode would be applied to the detail level of the chart. This would allow us to get a better overview even if the number of columns is limited.
Best regards,
Daniel
Selectable display mode for chart detail level IN BACKLOG
Straight into the backlog! :)


