Reports – configuration, views, editing
Applies to version 2020.1.x and 2021.1.x, author: Krzysztof Gawczyk
Introduction
This article explains how to create and configure reports in WEBCON Designer Studio and on Portal. You can configure various views for your reports to present data (e.g., use charts, tables). It is also possible to create one report with all tasks, and views for each step. In this article, you will learn how to:
1) create new reports,
2) set default filters for them,
3) allow users to create private views for the reports,
4) edit the report’s view directly on Portal and save your custom view for later use.
Please note that you can import and export reports alongside the applications they belong to. You can also embed reports on SharePoint sites via Web Parts.
Report configuration
You can create and configure your report in Designer Studio or on Portal. Choose whichever is most convenient for you. First, let us show you how to create it on Portal. Then, we will show you how to do it in Designer Studio. The configuration is the same in both.
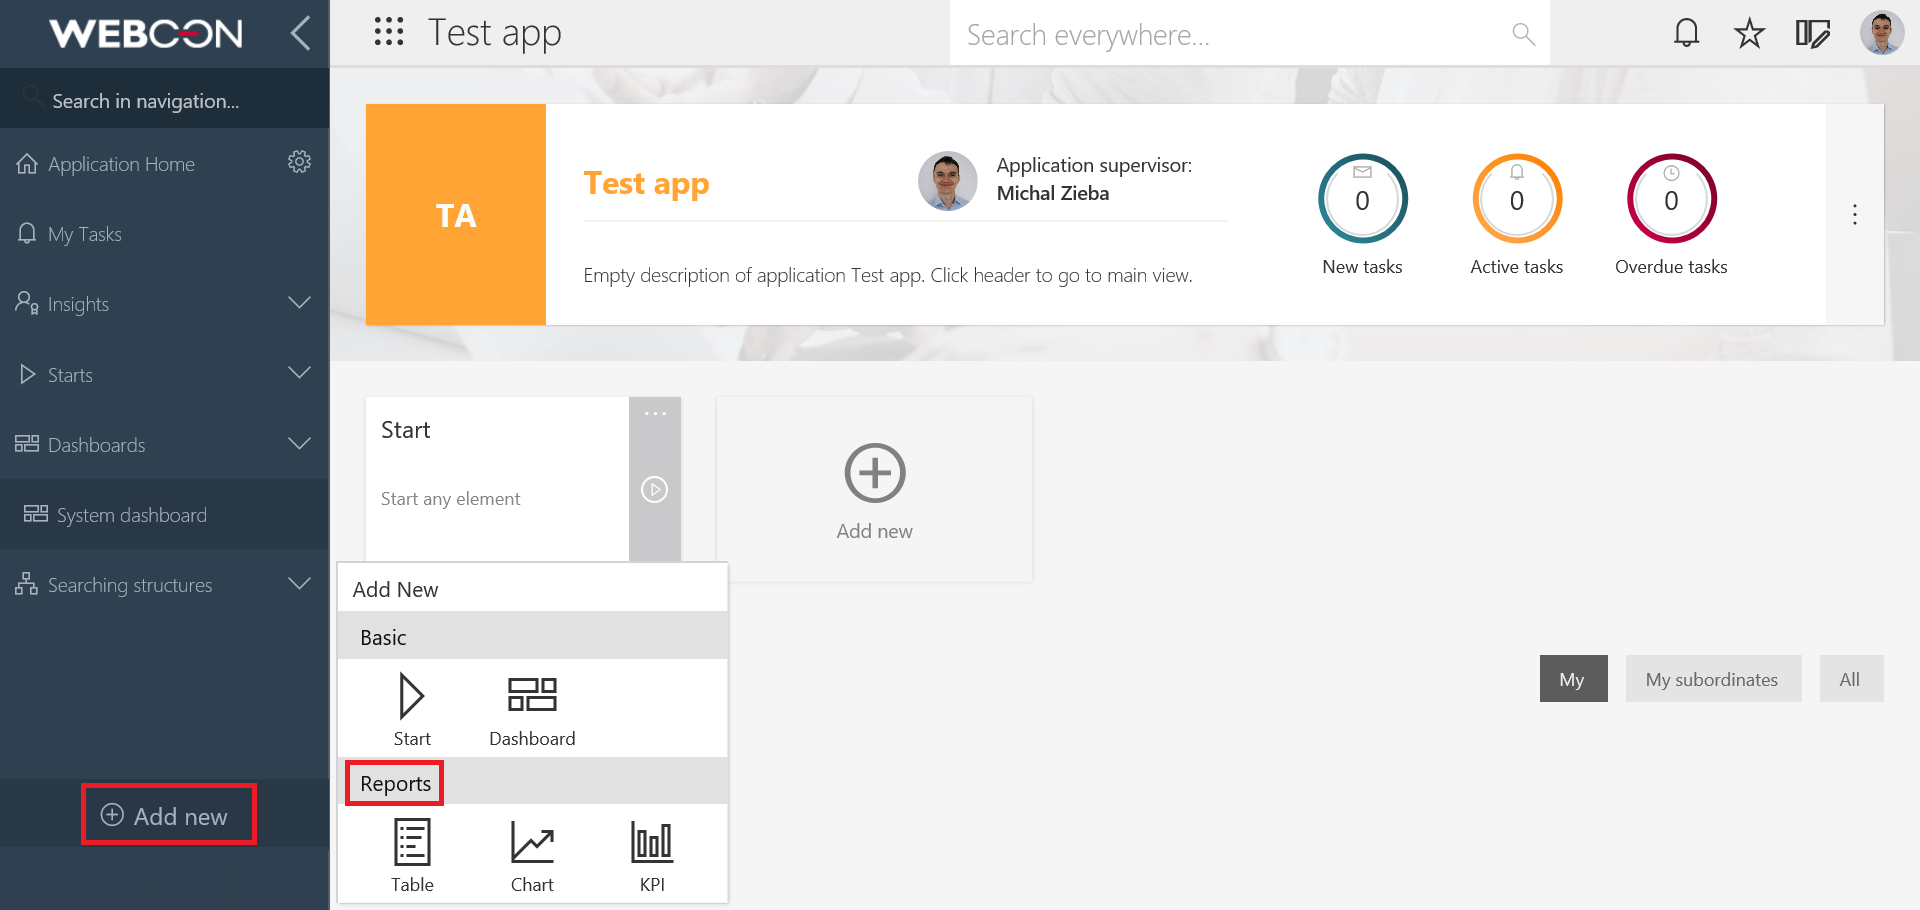
Choose an application for which you want to create a report and open it on your Portal. In the left down corner, you can see a plus symbol and the “Add new” button. Click it, and under the “Reports” section, choose the type of report you want to have (table, chart, or KPI).
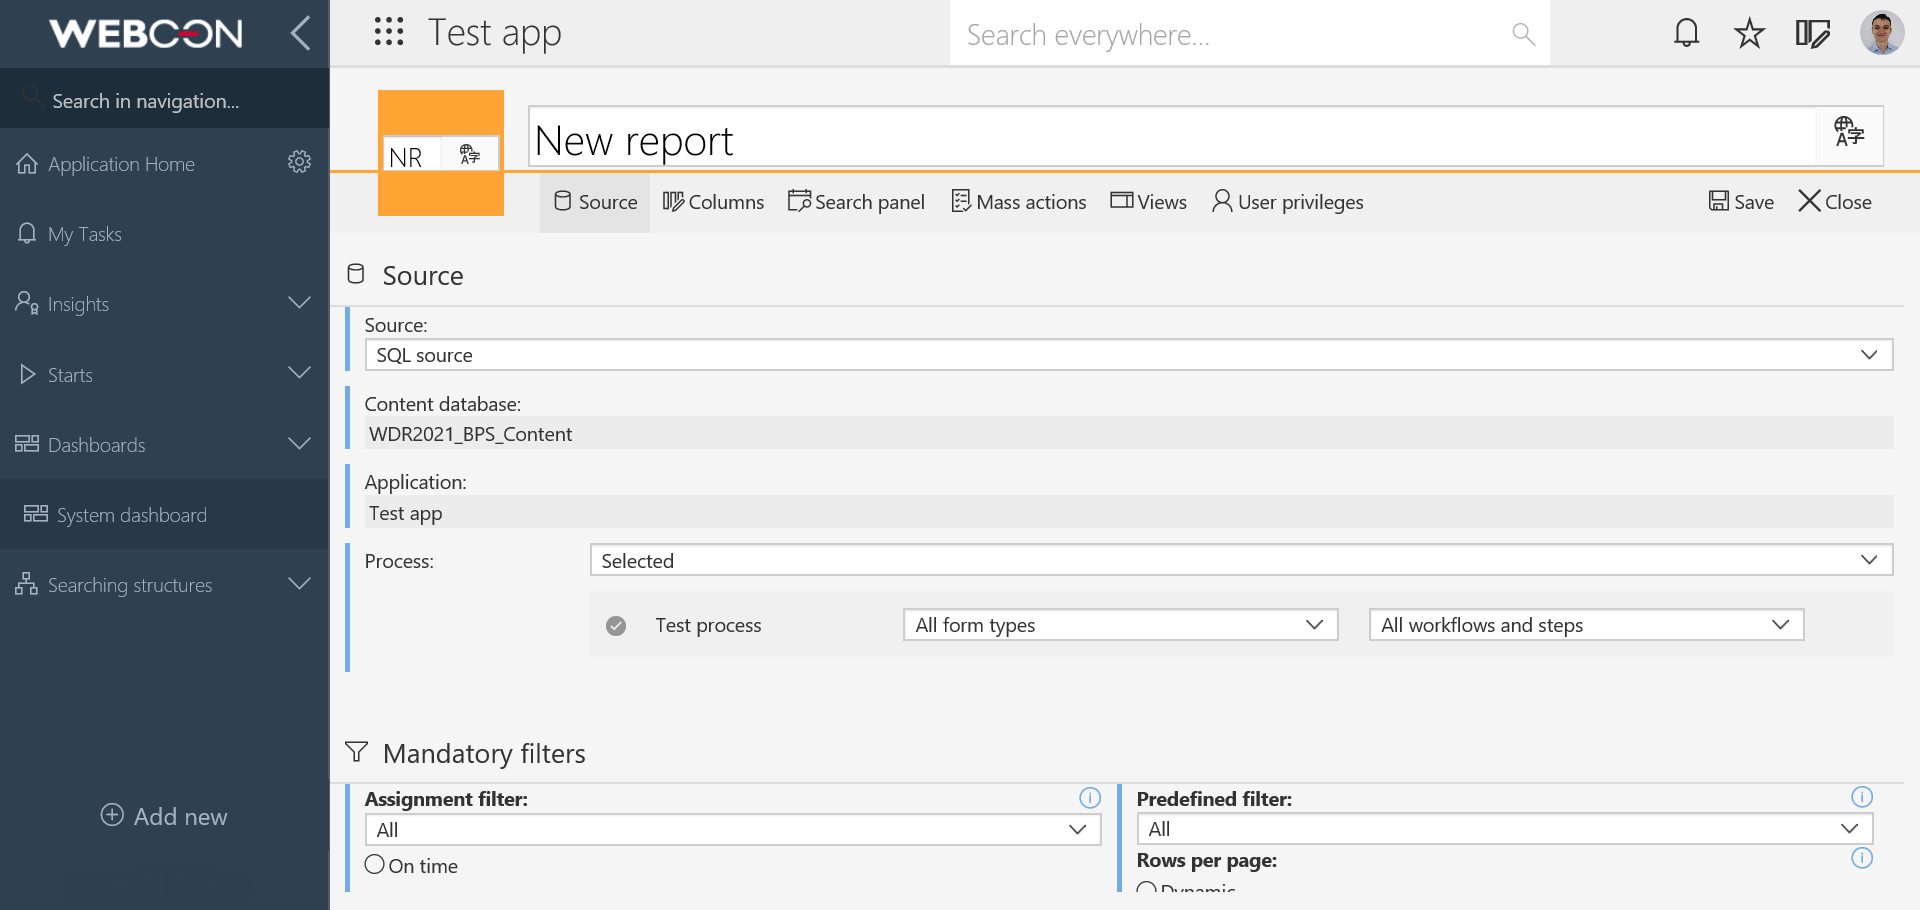
A window will appear where you can name and configure your report.
Now, let us tell you how you can create a report in Designer Studio. After that, we will explain how to configure it there. You can follow these instructions configuring your report on Portal, as the configuration is the same.
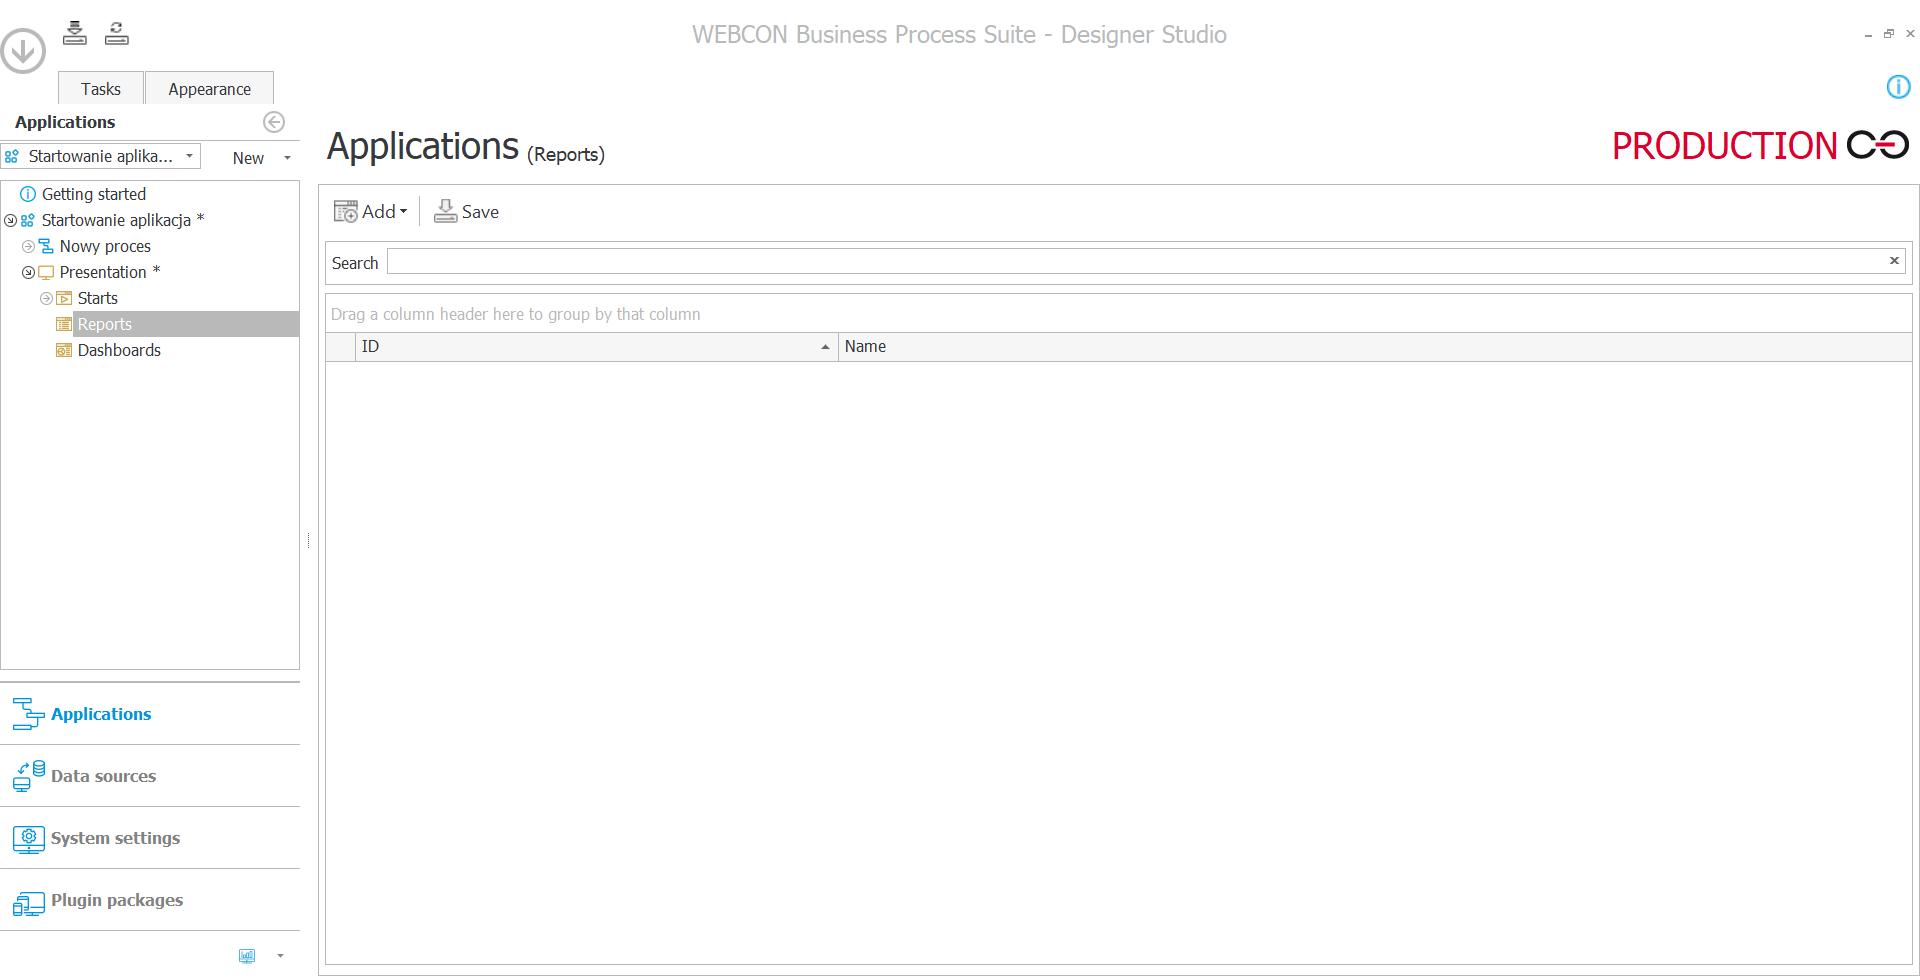
In Designer Studio, choose your application, and in the “Applications” tab, expand the “Presentation” tree. Now, you will see “Reports” below it. Select them. To create a new report, press the button “Add” (on the right) and choose if it should be a Table, Chart, or KPI. You can also use a shortcut CTRL + N if you want to have a new report in the form of the table.
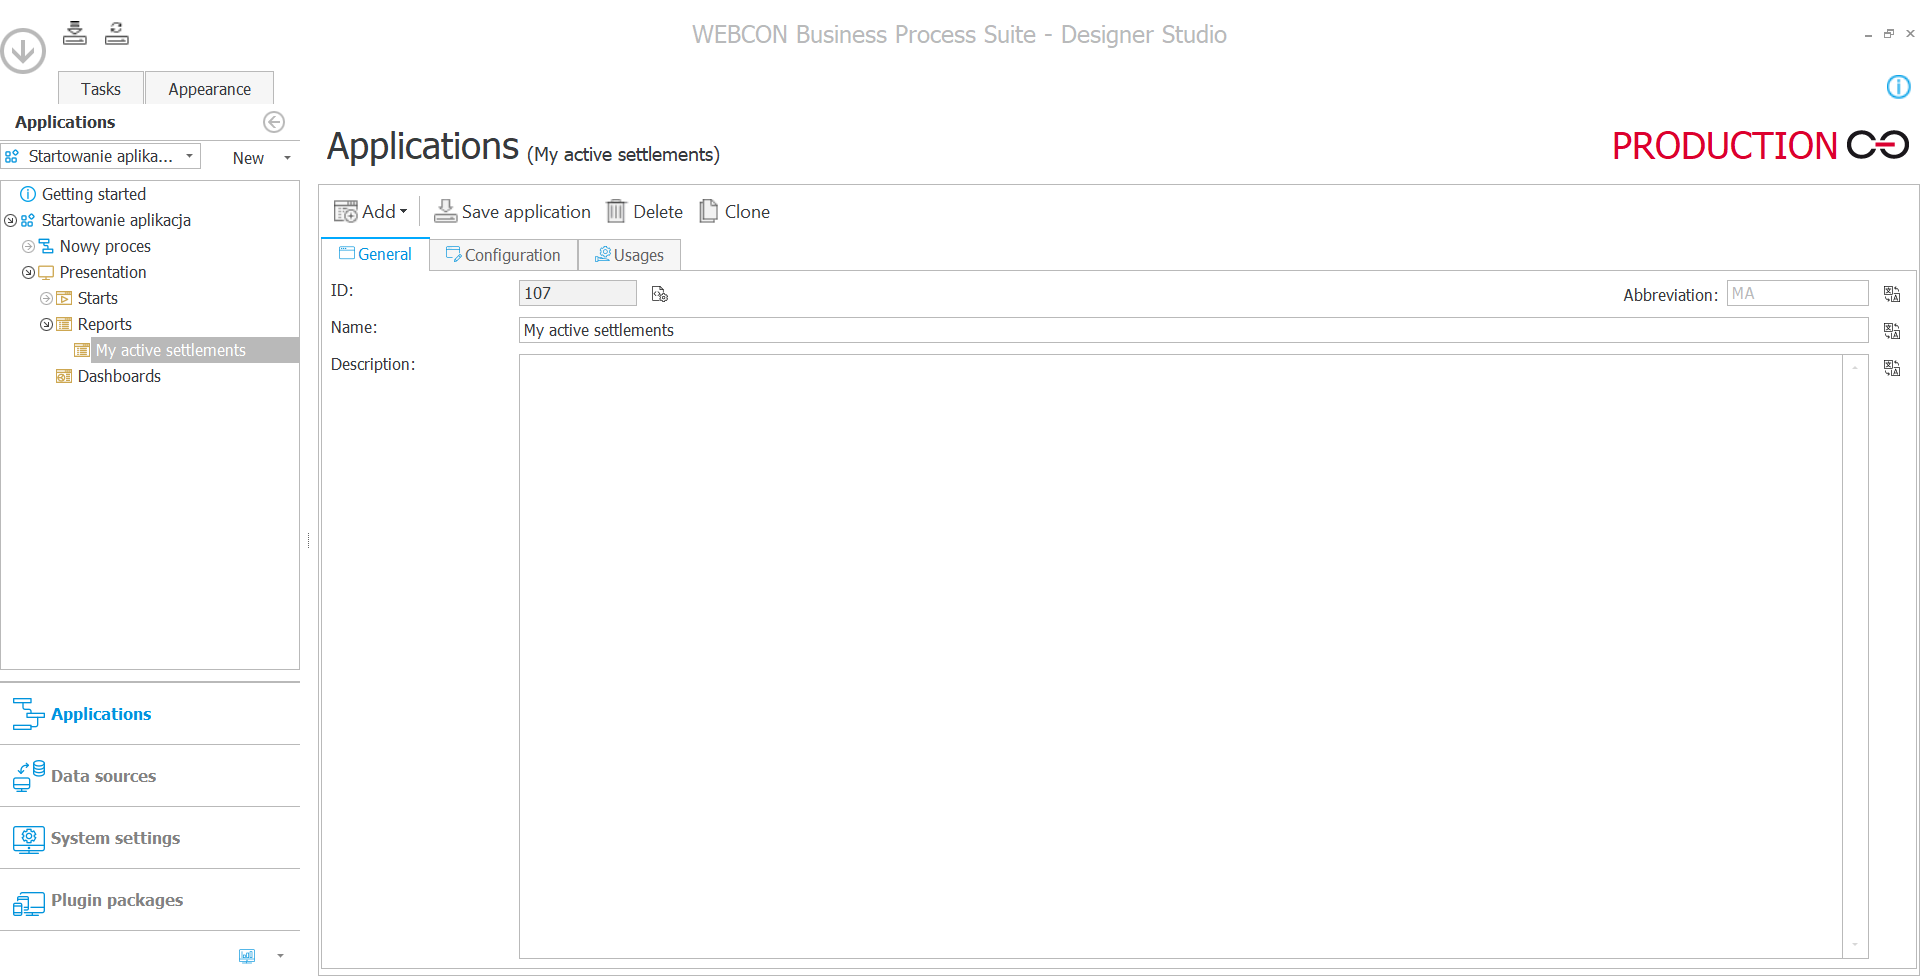
Then, name the newly created report and open the “Configuration” tab above the name field to configure your report.
In the “Configuration” tab, start with configuring the Source for your report. Select from which process, form type, workflow and steps, the data for the report should be downloaded.
When selecting form types, you can select all form types or choose “Selected form types” and select one or more form types. The same is true for workflows and steps, i.e., you can select all of them or select just some workflows and/or steps.
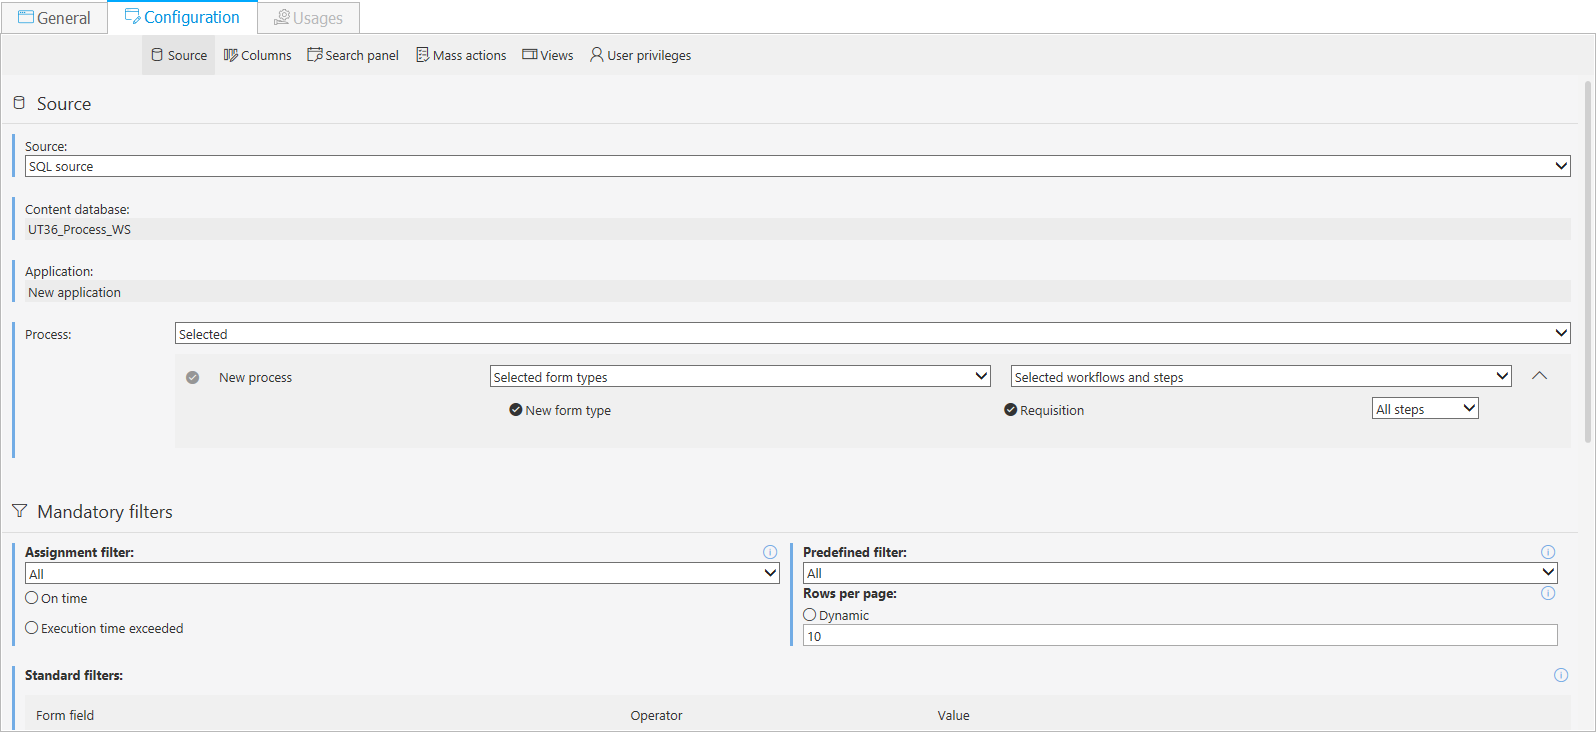
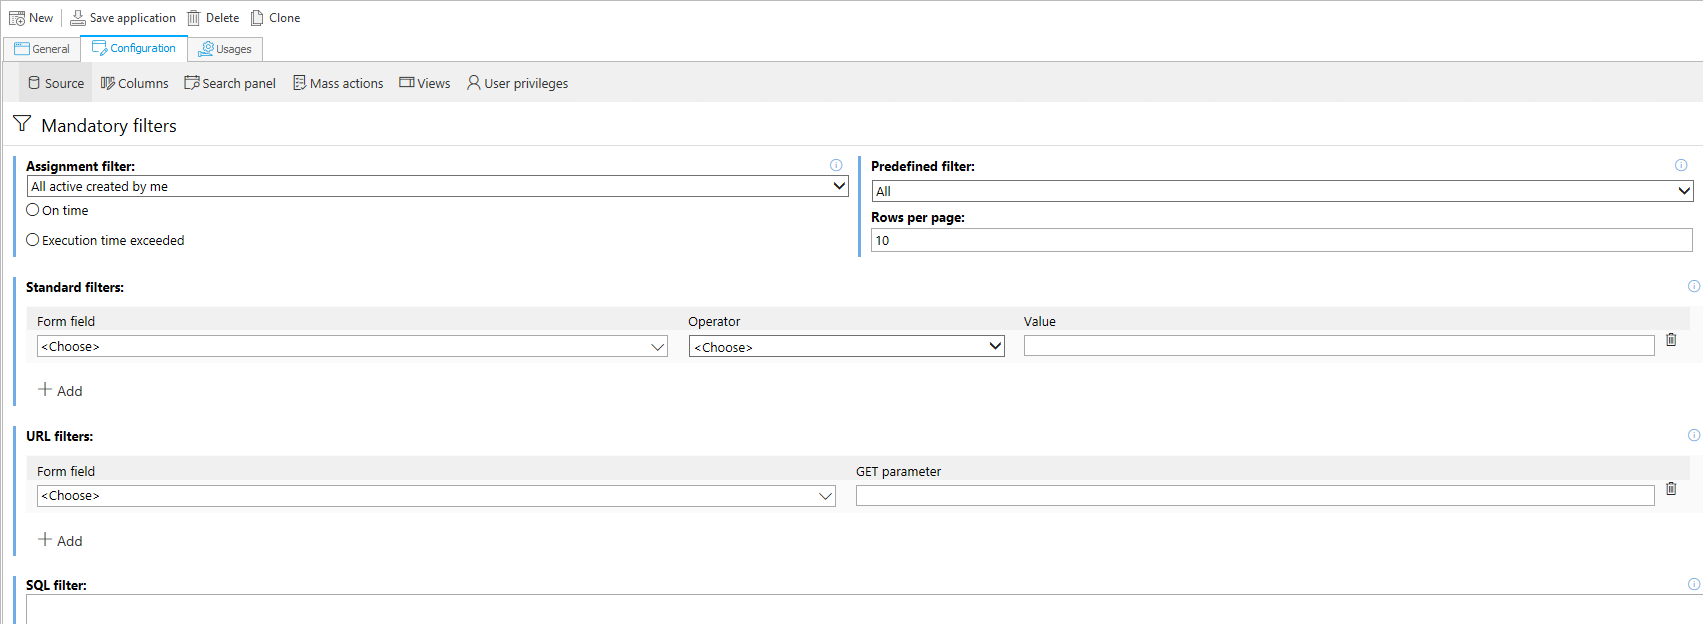
You can also find here a group “Mandatory filters” in which the user can put filters on tasks that should be included in the report. You can:
1) use “Rows per page” to set how many rows should be displayed per page (if you select “Dynamic,” the number of workflows instances shown on the report will adjust automatically to the browser’s window size),
2) use “Standard filters” to filter by form fields (and their values), e.g., deciding to display only instances in which a certain form field has a given value (for example, “Total price” form field is greater than 1,000),
3) use “URL filters” to narrow down the displayed data by the URL’s parameter(s). For example, you can display only the reports that contain software acquisition by entering the URL with the right parameter into the address bar. It could look like this: https://www.webcon.com/WEBCONBPS/db/1/app/report/2?VALUE1=Software
4) use SQL filters to filter how many workflow instances should be shown on the report. The condition should be entered after the keyword AND; for example, AND YEAR(GETDATE())=2021
Click on the tab “Columns” to select which columns should be used in the report. System columns are displayed by default. You can add columns with form fields that are a part of the process and the workflow. You can also add calculated columns; their configuration is explained in in this article.
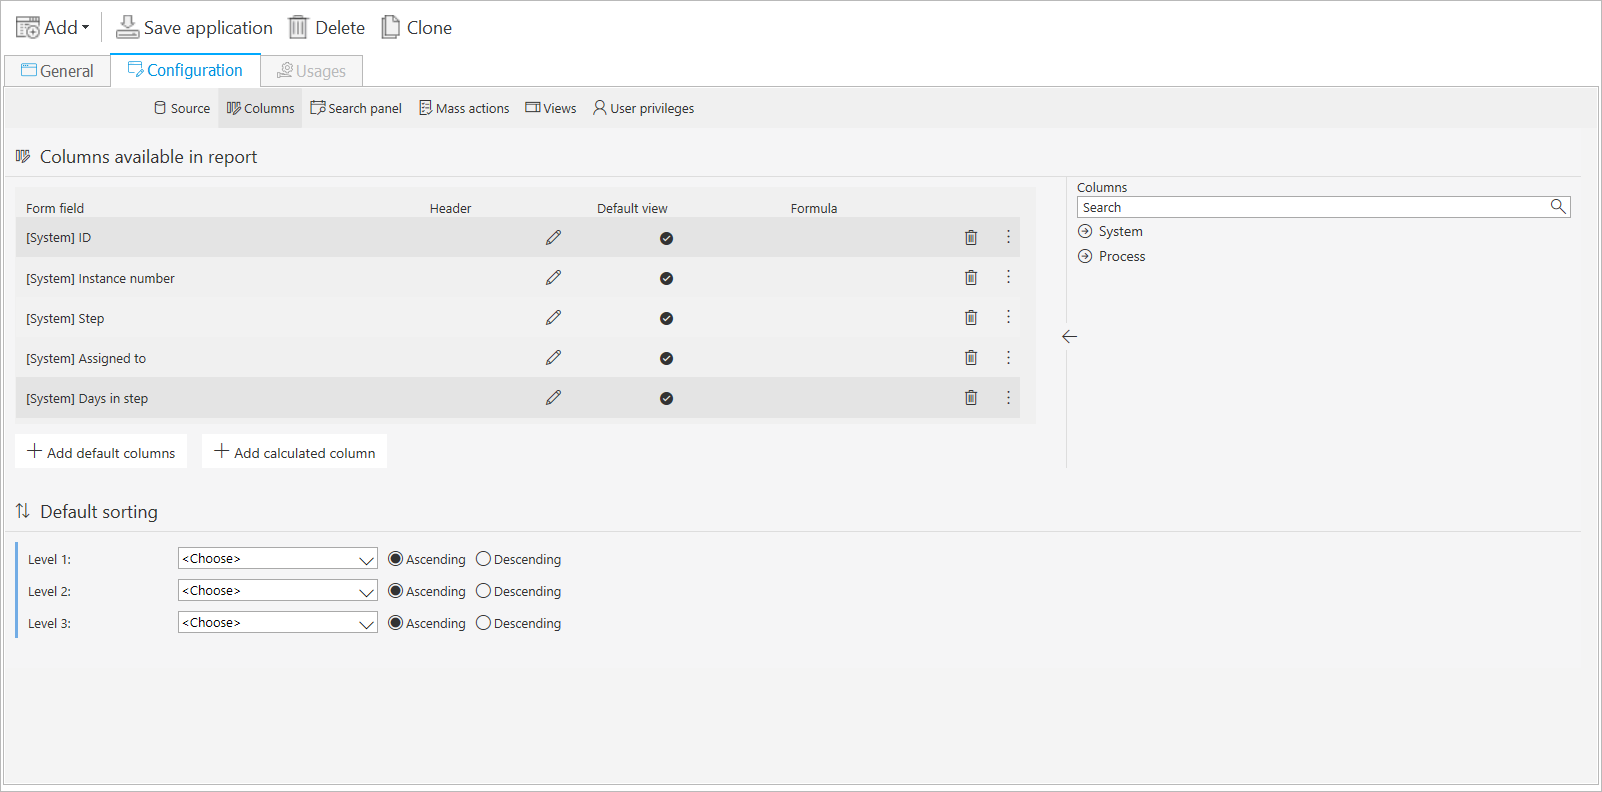
Under “Default Sorting,” you can sort data in chosen columns.

Another report configuration tab is named “Search panel.” Here, you can choose the form fields by which the user can search the collected data. None of the columns are selected by default. Choose fields by which the tasks can be easily found.

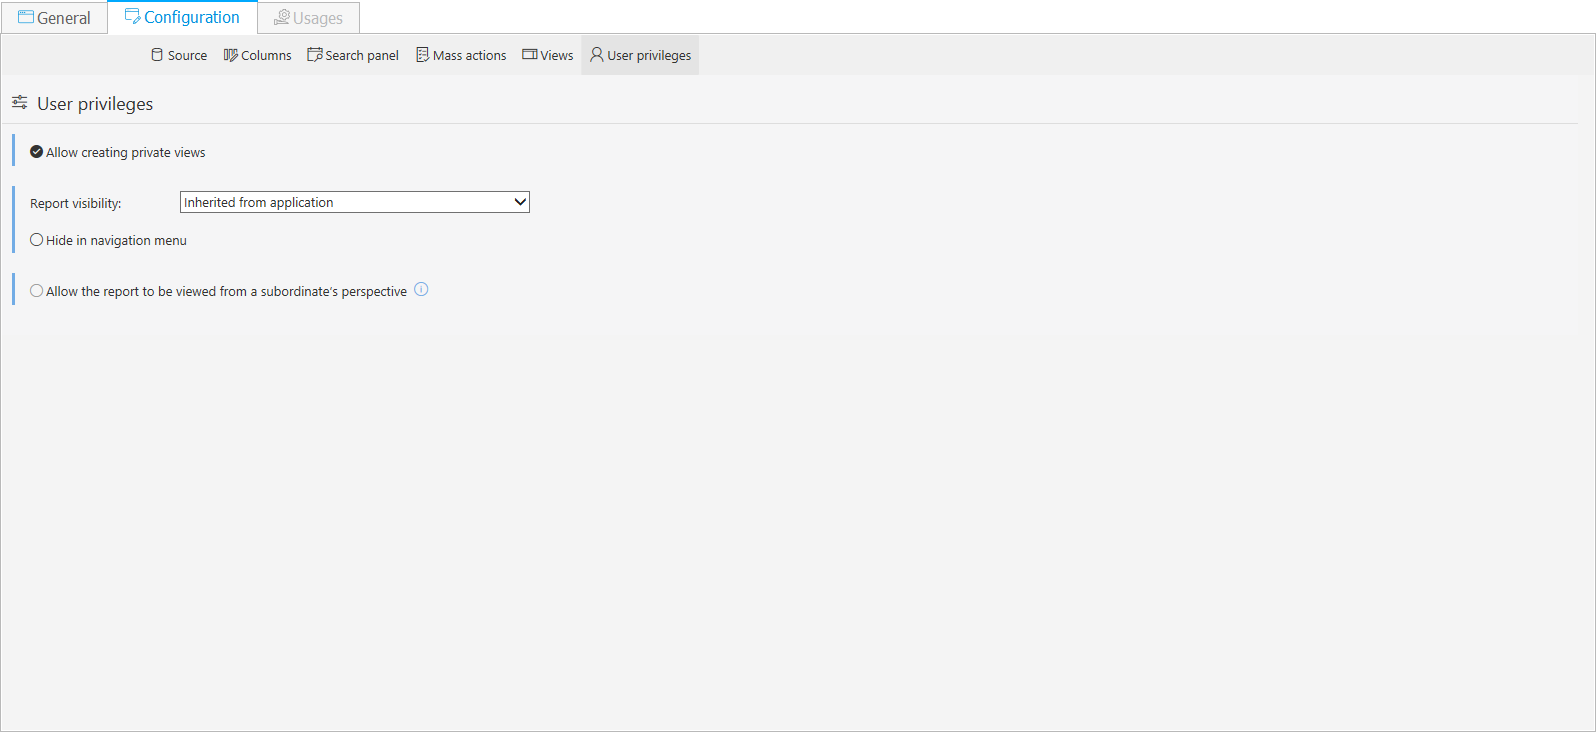
Another stage of report configuration is view configuration which is described in detail in the following paragraph. The last part of the configuration is giving privileges for the reports. They give users options to create private views and choose non-standard report visibility (breaking inheritance of privileges from the application). Those privileges can be given to AD users.
Views
Report views allow users to create individual views based on data collected from a data source. Those views are created without administrators’ participation. View configuration includes many groups, which are described later in this article. The first two groups are linked to the views list that was recently added.
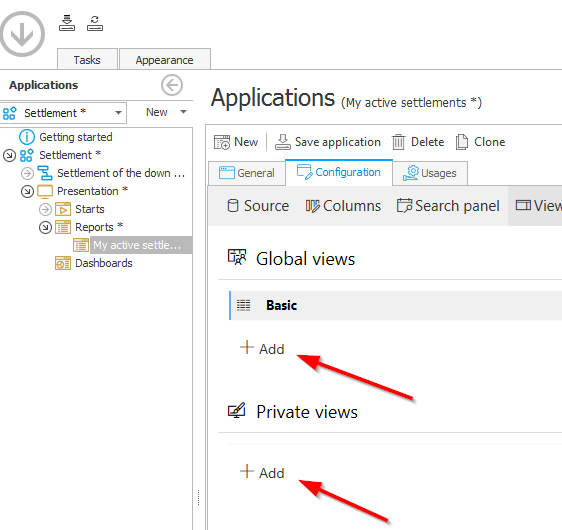
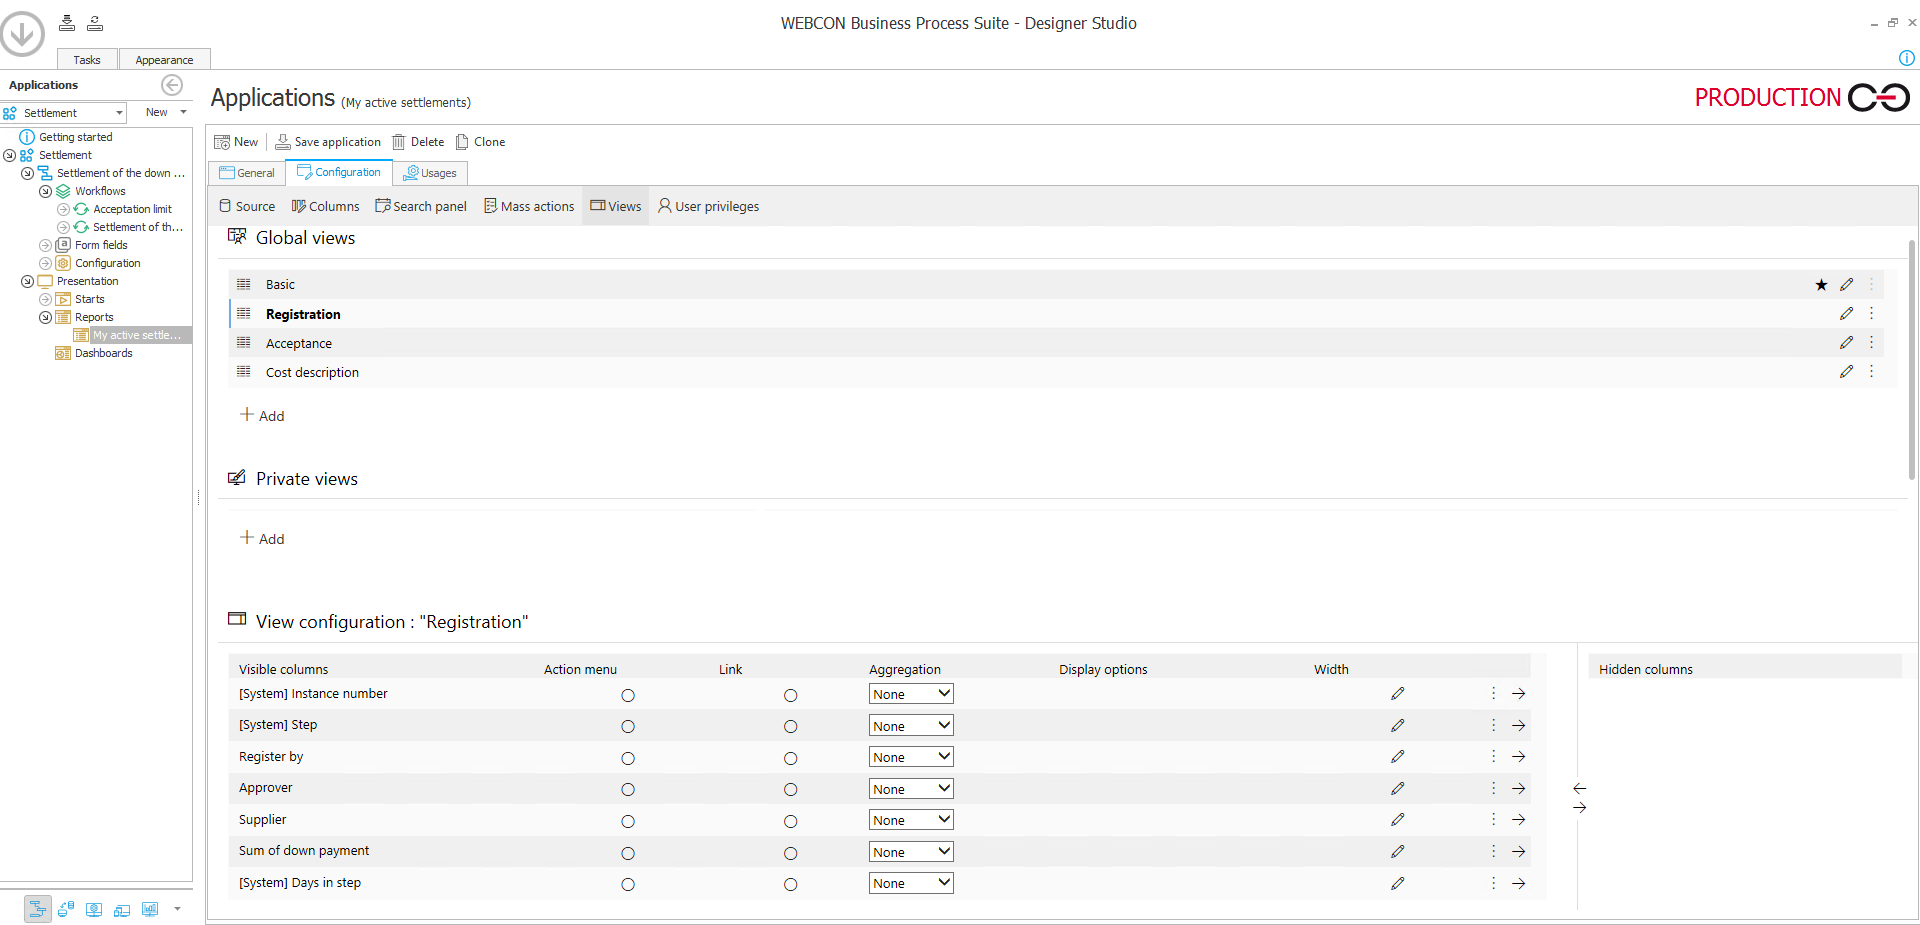
By default, you have a “Basic” view that includes information chosen on previous report configuration stages. You can add a new global or private view with a dedicated button. Private views are temporary views that are not globally visible. Then, you can configure the “View configuration: Basic.” Here, you have available the columns that you have chosen in the report’s “Columns” tab.
You can choose which report’s columns should be visible and decide if a column should have an action menu or contain a link to the task. In “Aggregation,” you can leave the default “none” option or choose “count” to aggregate the data from the column. This way, you can, for example, count the total value of acquisitions.
Under “Style,” you can set the width of a column. When you click on the three dots next to it, you can hide the column, move it down or move it to the bottom. Next to it, there is an arrow. When pressed, it moves the column to the “Hidden columns” and hides it in the report. The hidden columns are listed on the right.
When the user browses the report, they see the columns you have set to be visible. However, they also can display the columns you have set to be hidden.

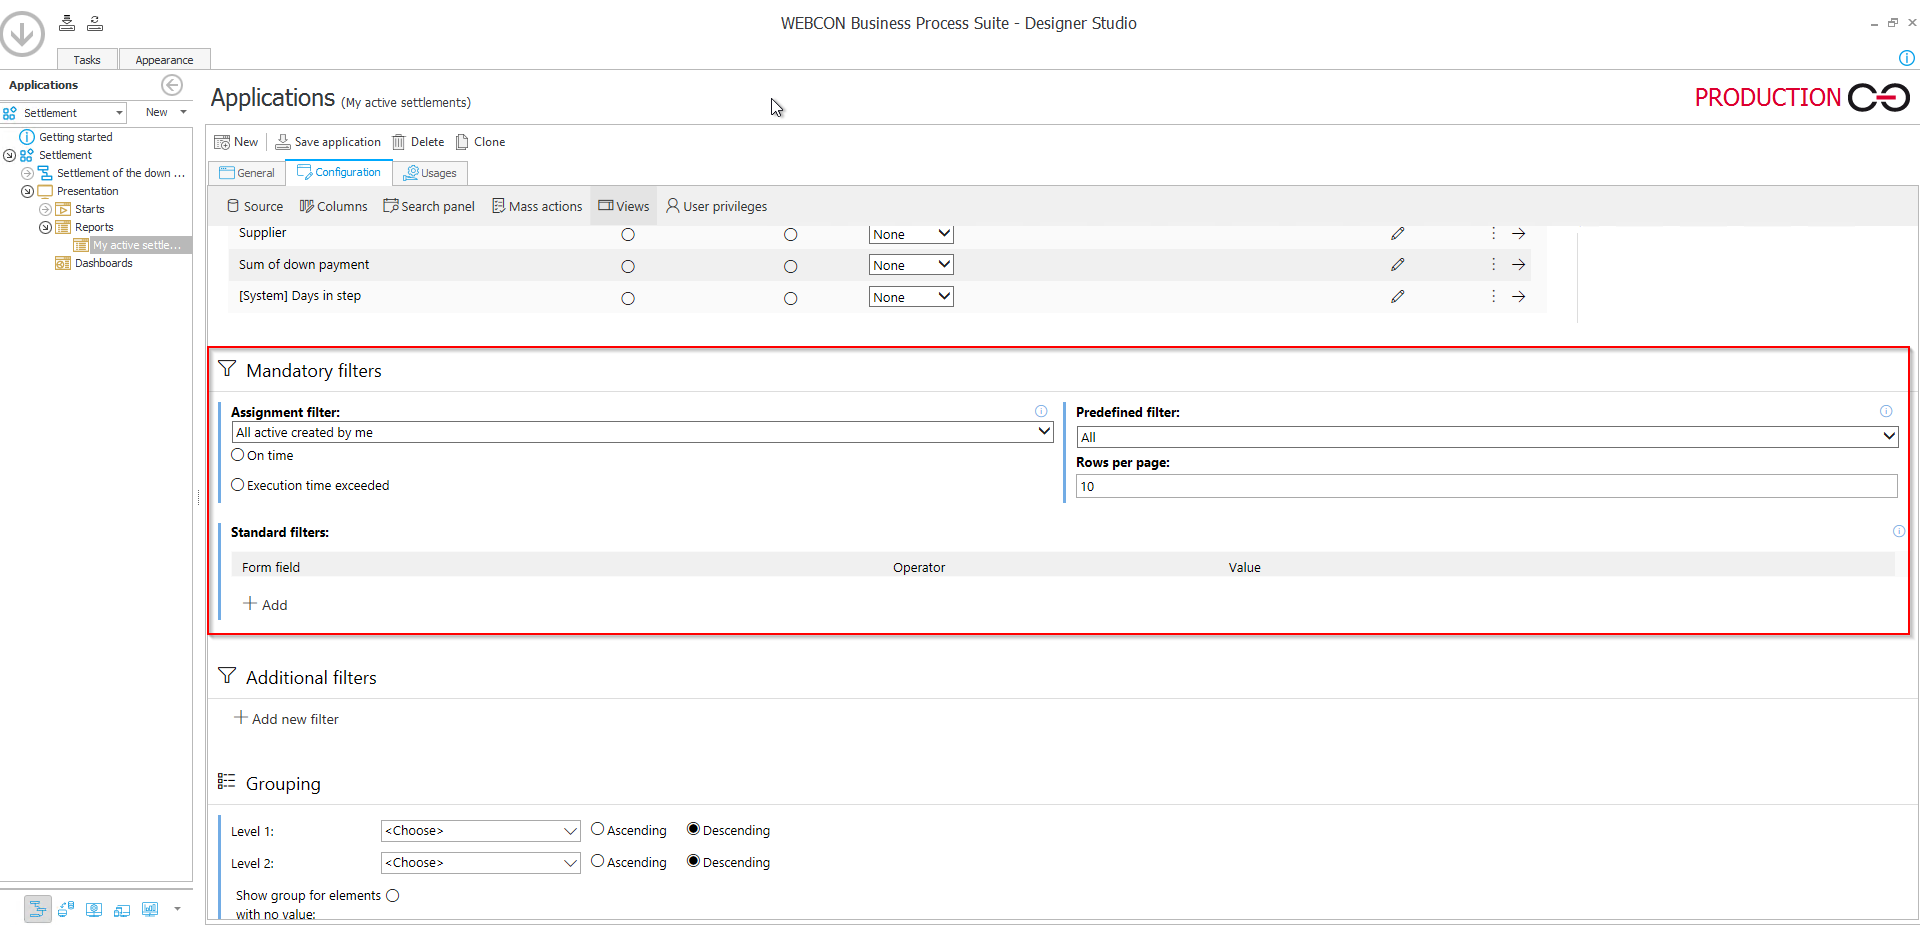
Under “Mandatory filters,” you can choose how you want to display the data by selecting an assignment filter. You can also set a predefined filter and put a filter on a form field. They work the same as “Mandatory filters” in the “Source” configuration tab.
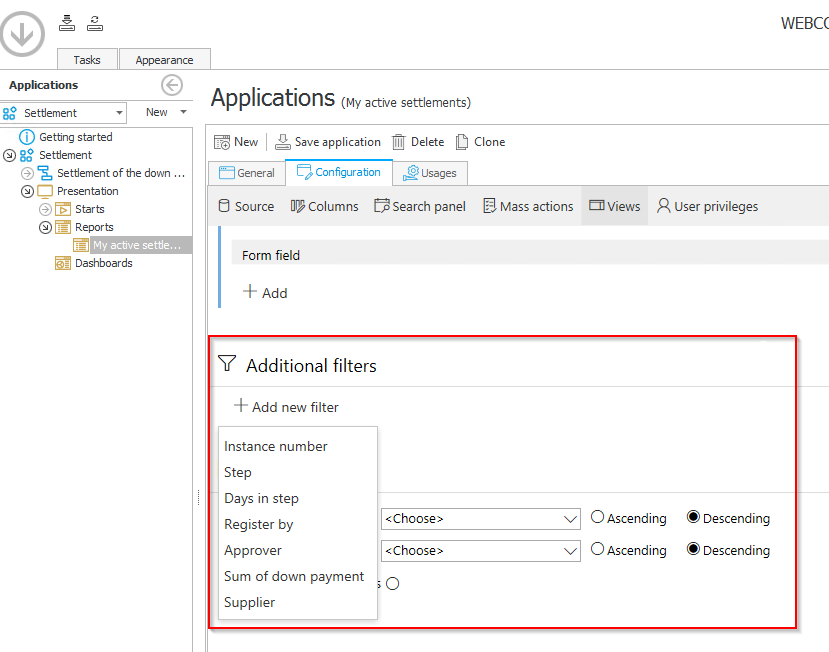
You can also put an additional filter on one of the system parameters and form fields presented in this step.
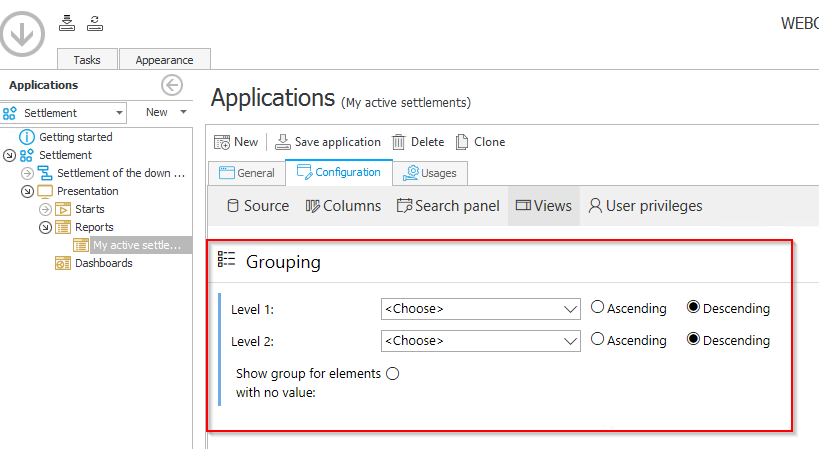
It is also possible to group form data on two levels, and on each of them, choose one of the form fields. Moreover, you can display all elements with empty values as a group by selecting “Show group for elements with no value.”
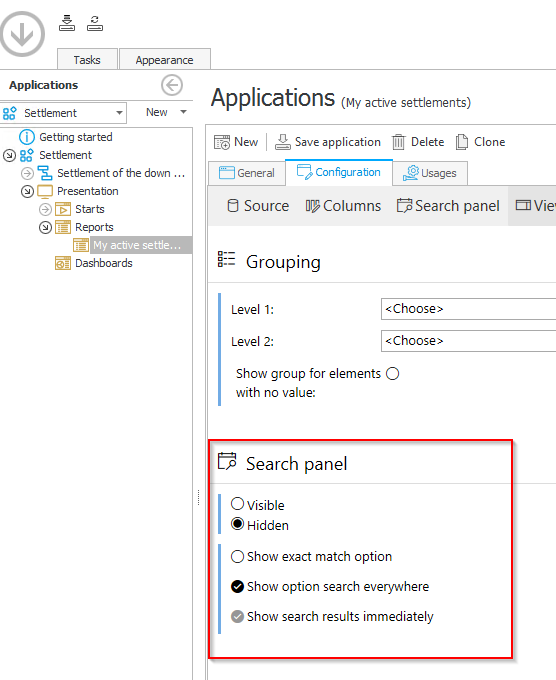
You can also hide or display the search panel and configure it accordingly. The way the search engine works is set directly in the report configuration. However, here you can decide if it should be visible or hidden.
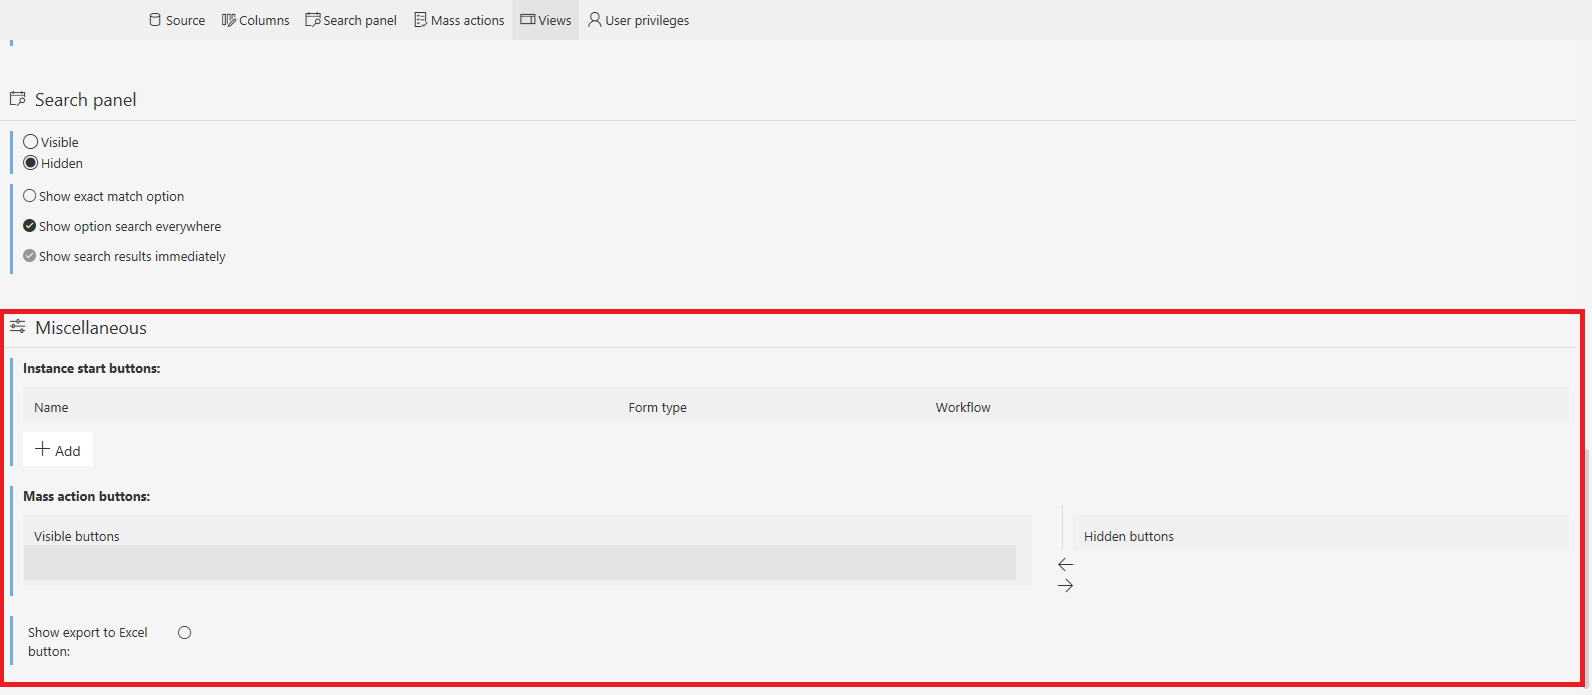
Under “Miscellaneous” (the last section in the “Views” configuration), you can provide users with an option to generate an Excel file from the report by clicking a button.
Below you can see the final report view configuration:
Editing and view creation on Portal
Each user with access to a report can edit how this report is displayed for them on Portal. To do so, click the down arrow next to a column’s name and choose the filters you want to apply.
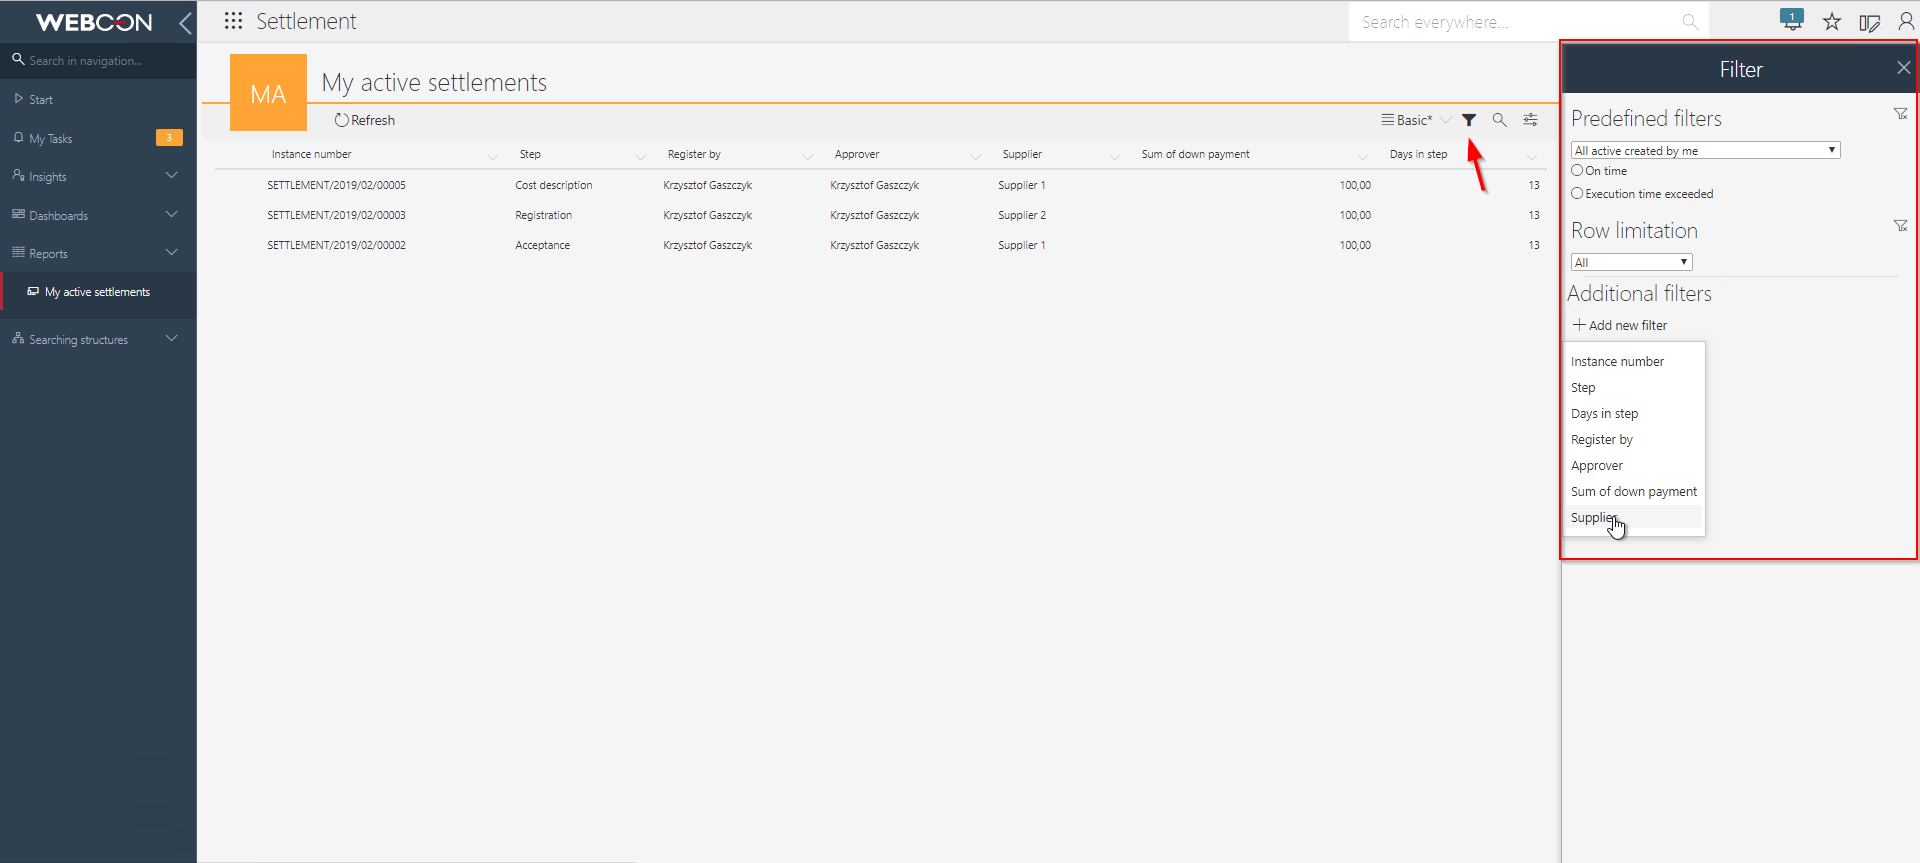
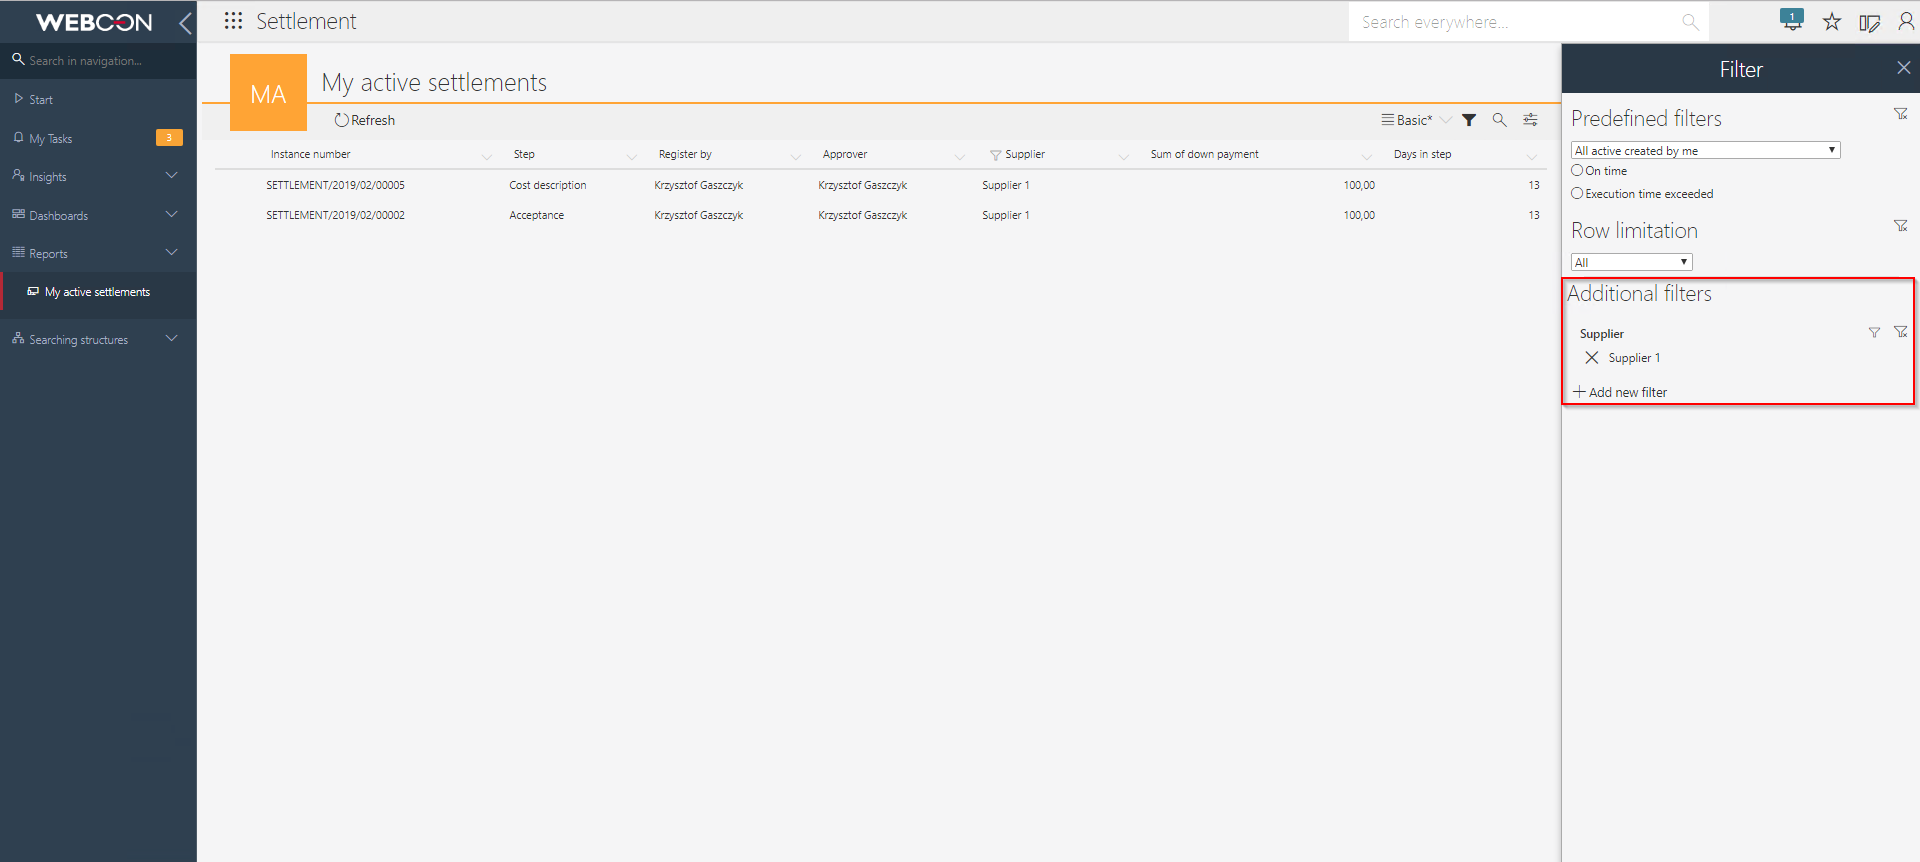
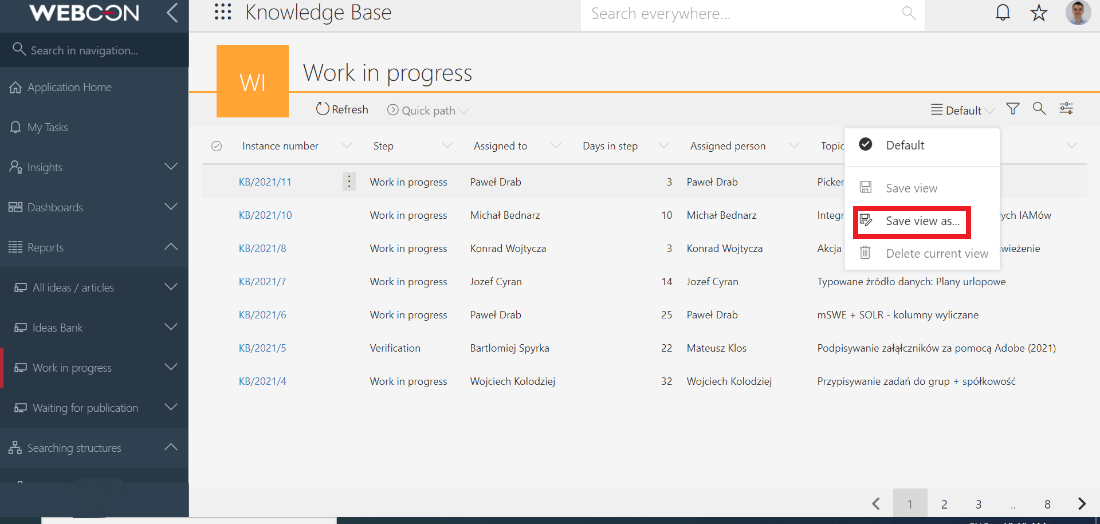
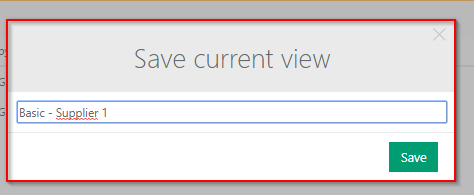
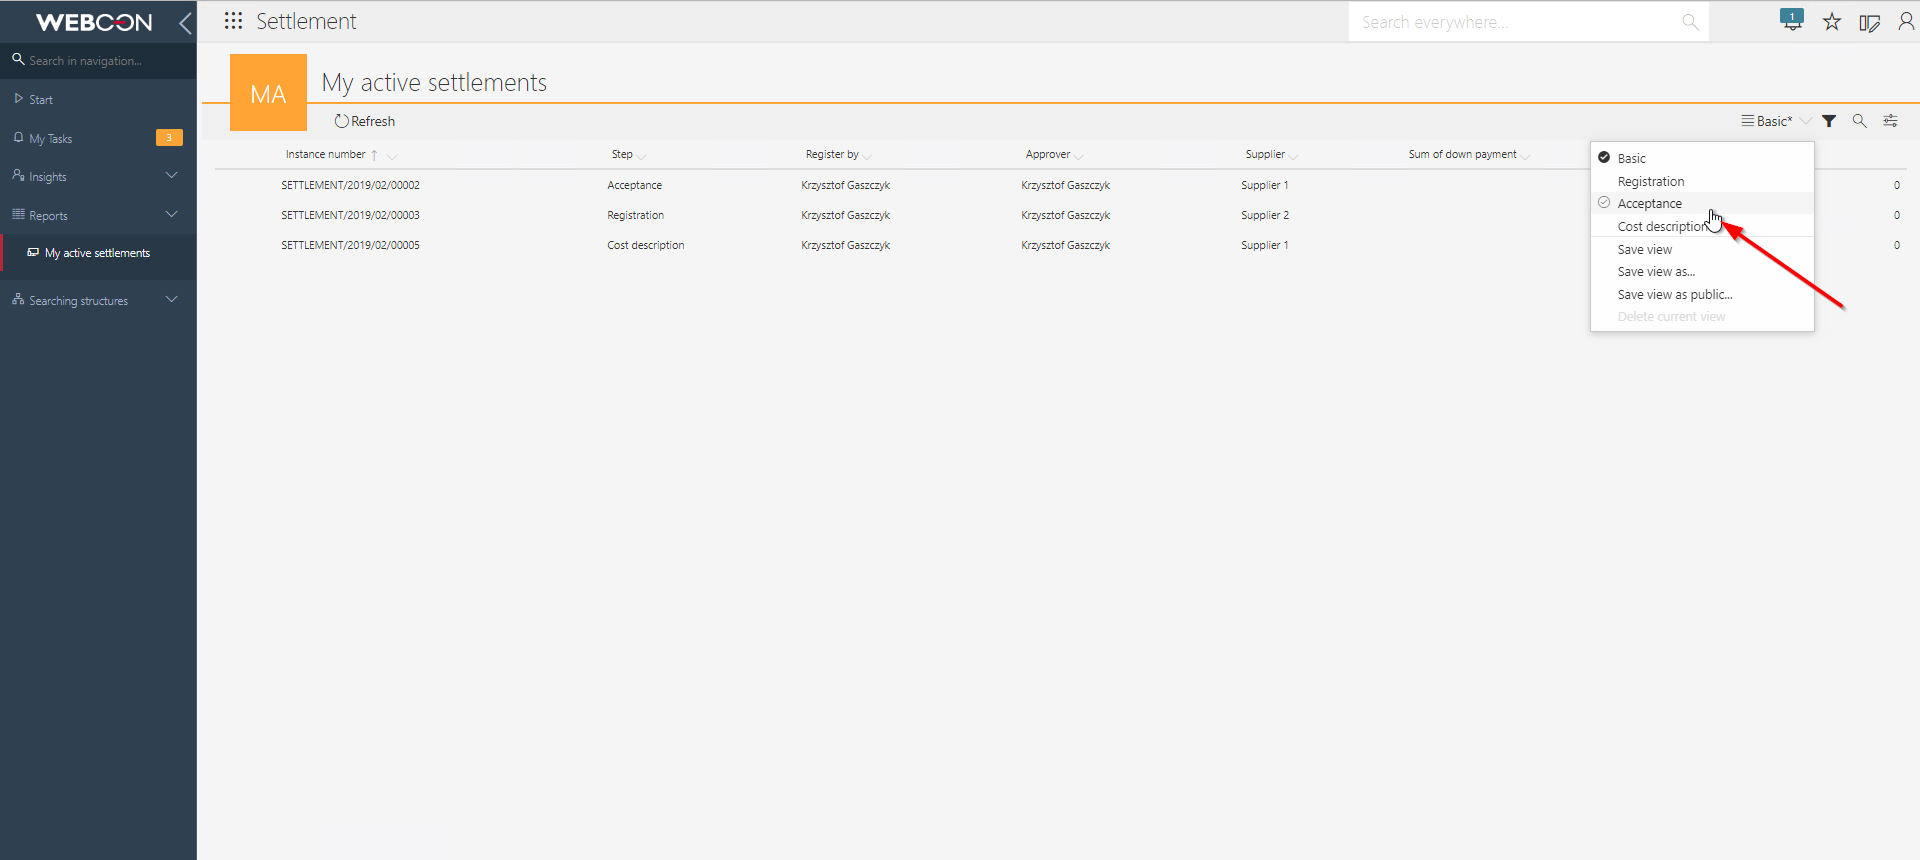
After applying the filters you want, you can save them in your view. To do so, in the right corner of the report’s view, click on the four horizontal lines (see the figure below). There, select “Save view as” and enter the name of your custom report’s view.
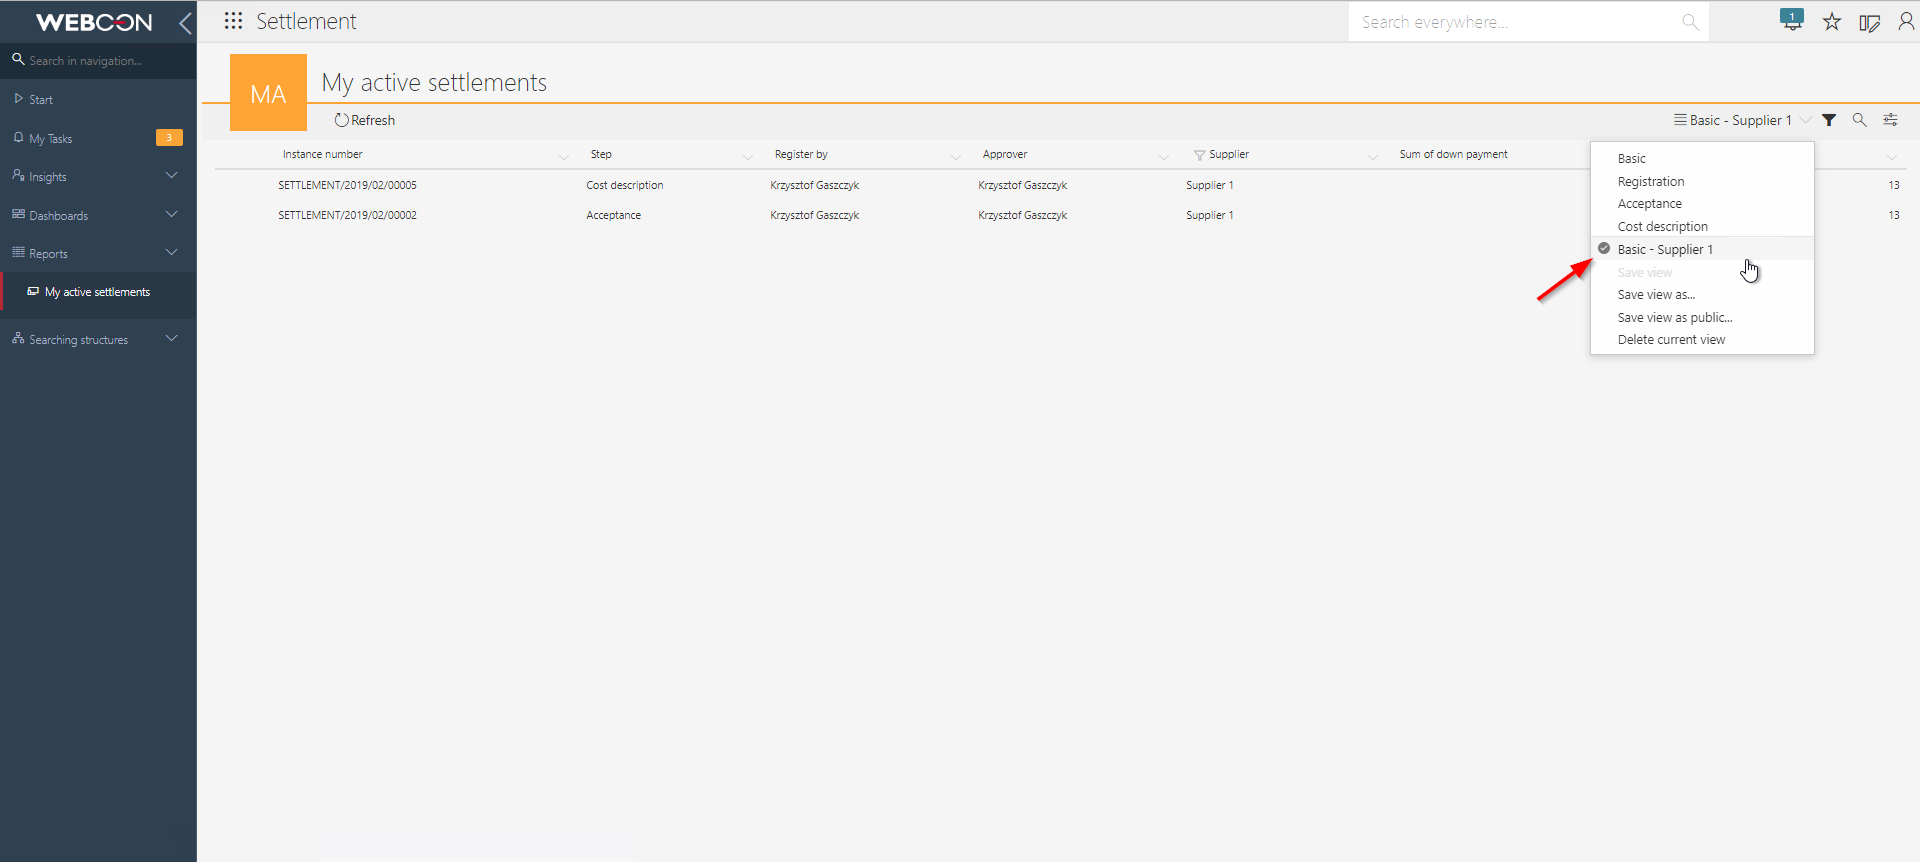
Once you have set the view with your column filters applied, you can go back to it any time. To do so, click on the four horizontal lines in the right corner of the report’s window and choose the name of the view you want to use.
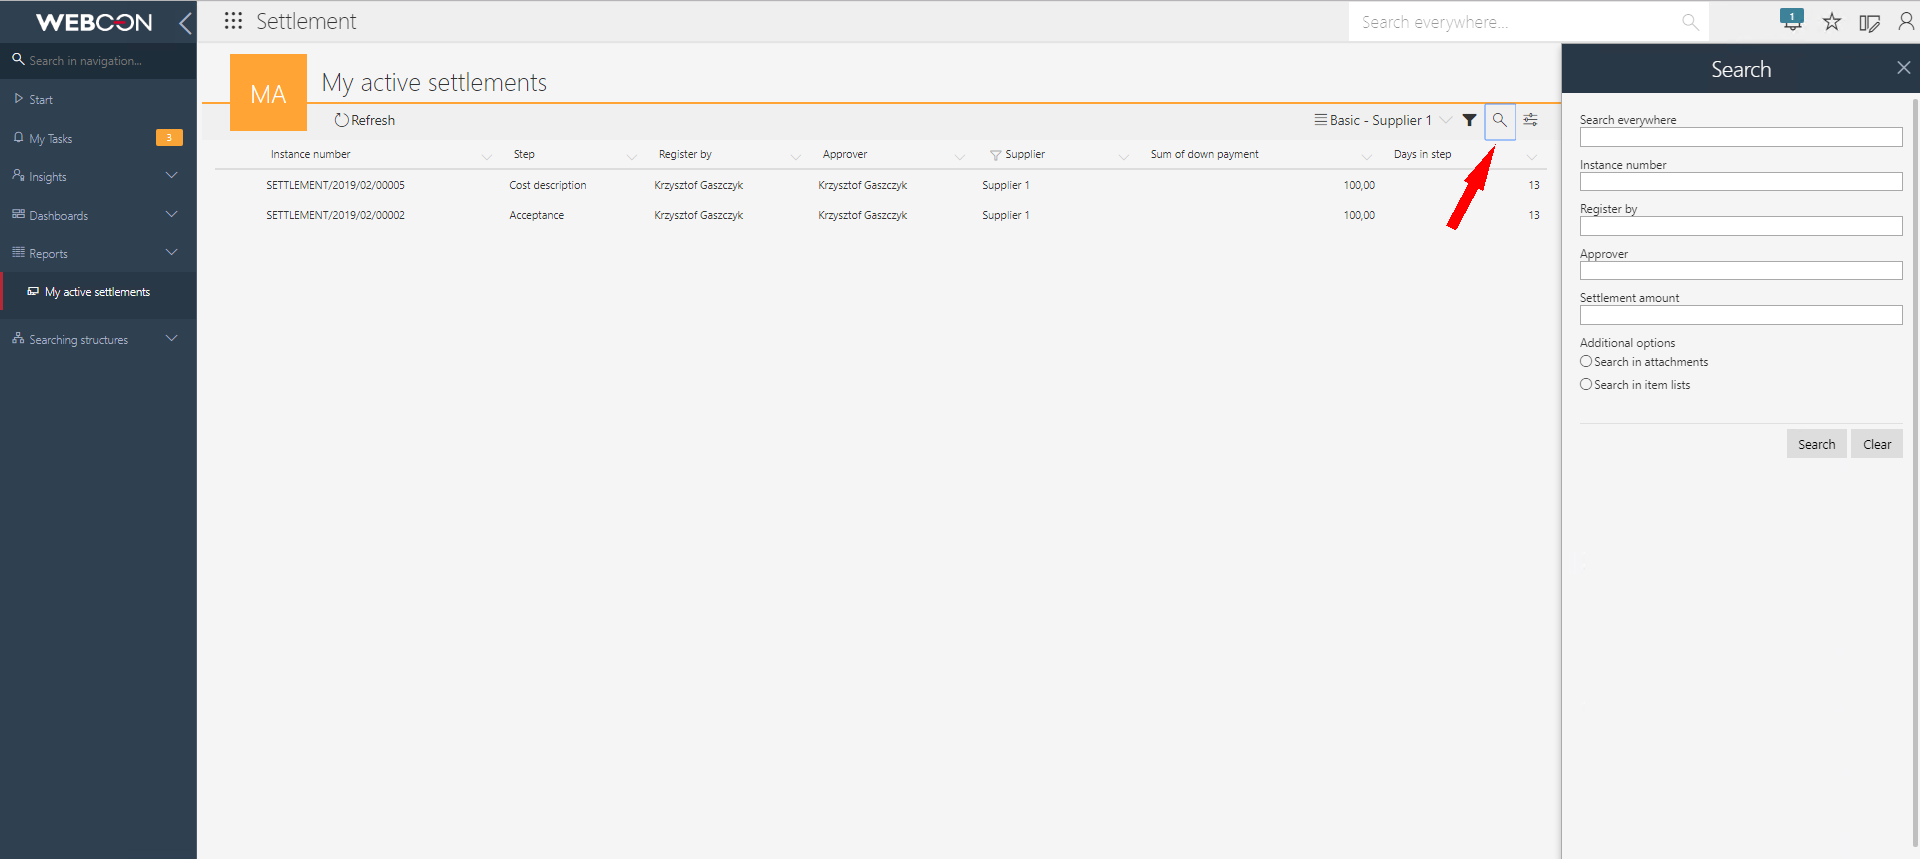
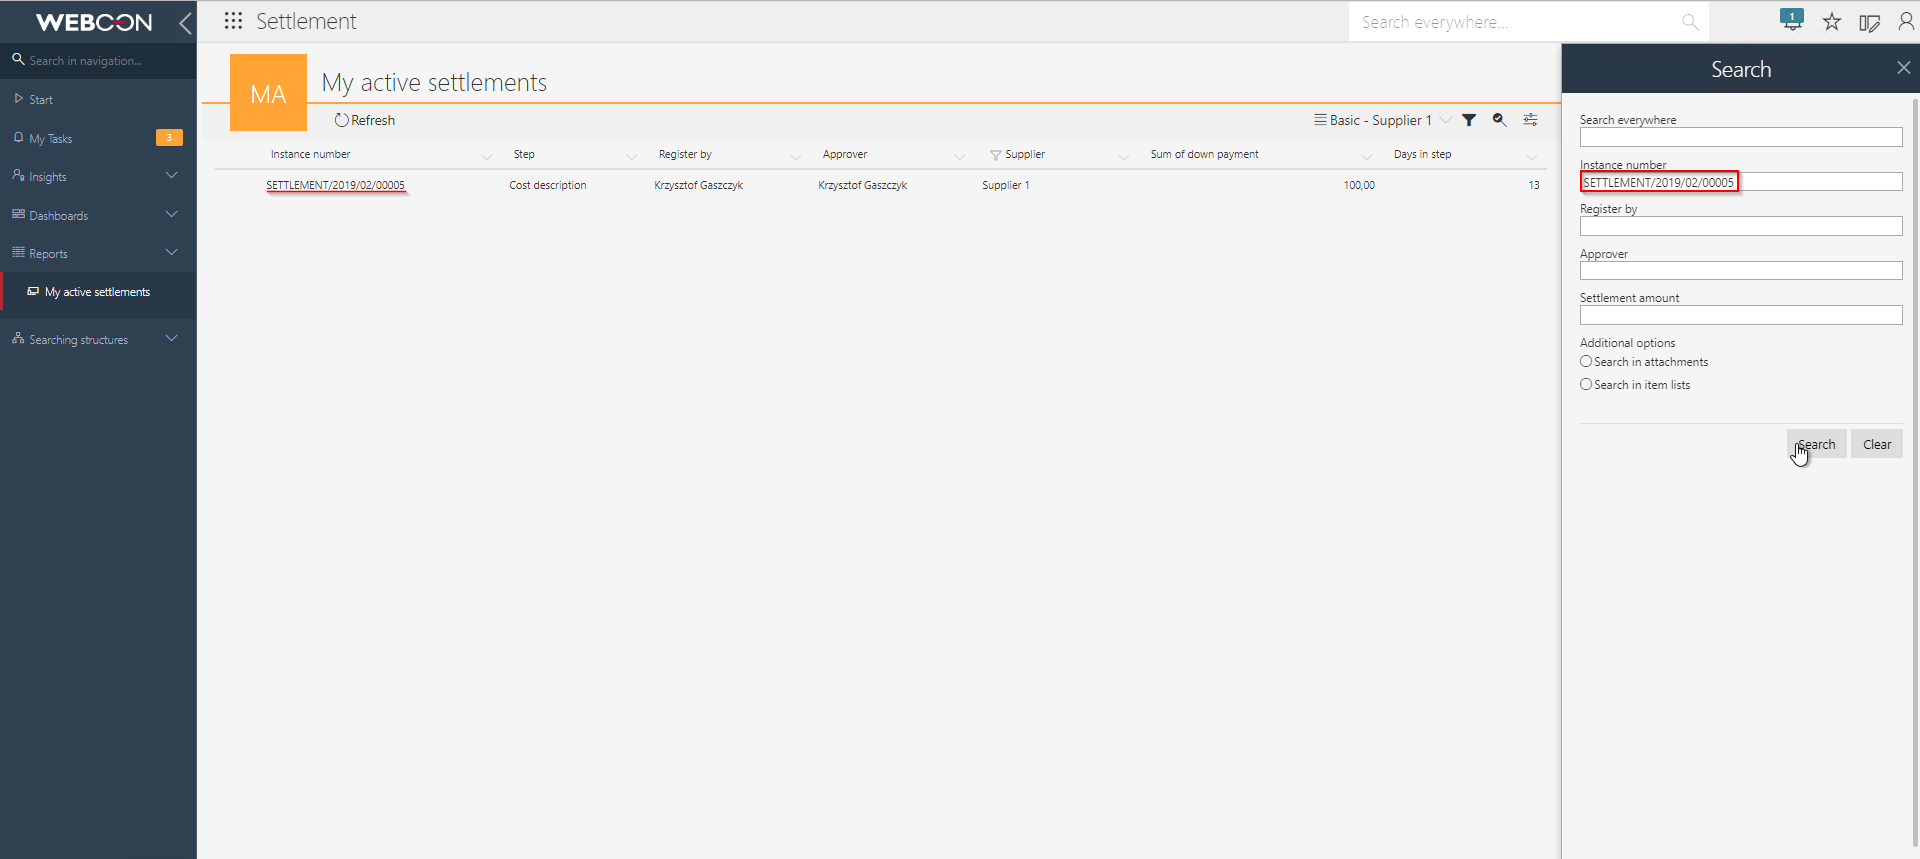
After creating the report, you can search for information inside it. The search criteria you can use have been defined in the report configuration. To start searching, click on the magnifying glass icon on the right side of the view’s name.
Final effect
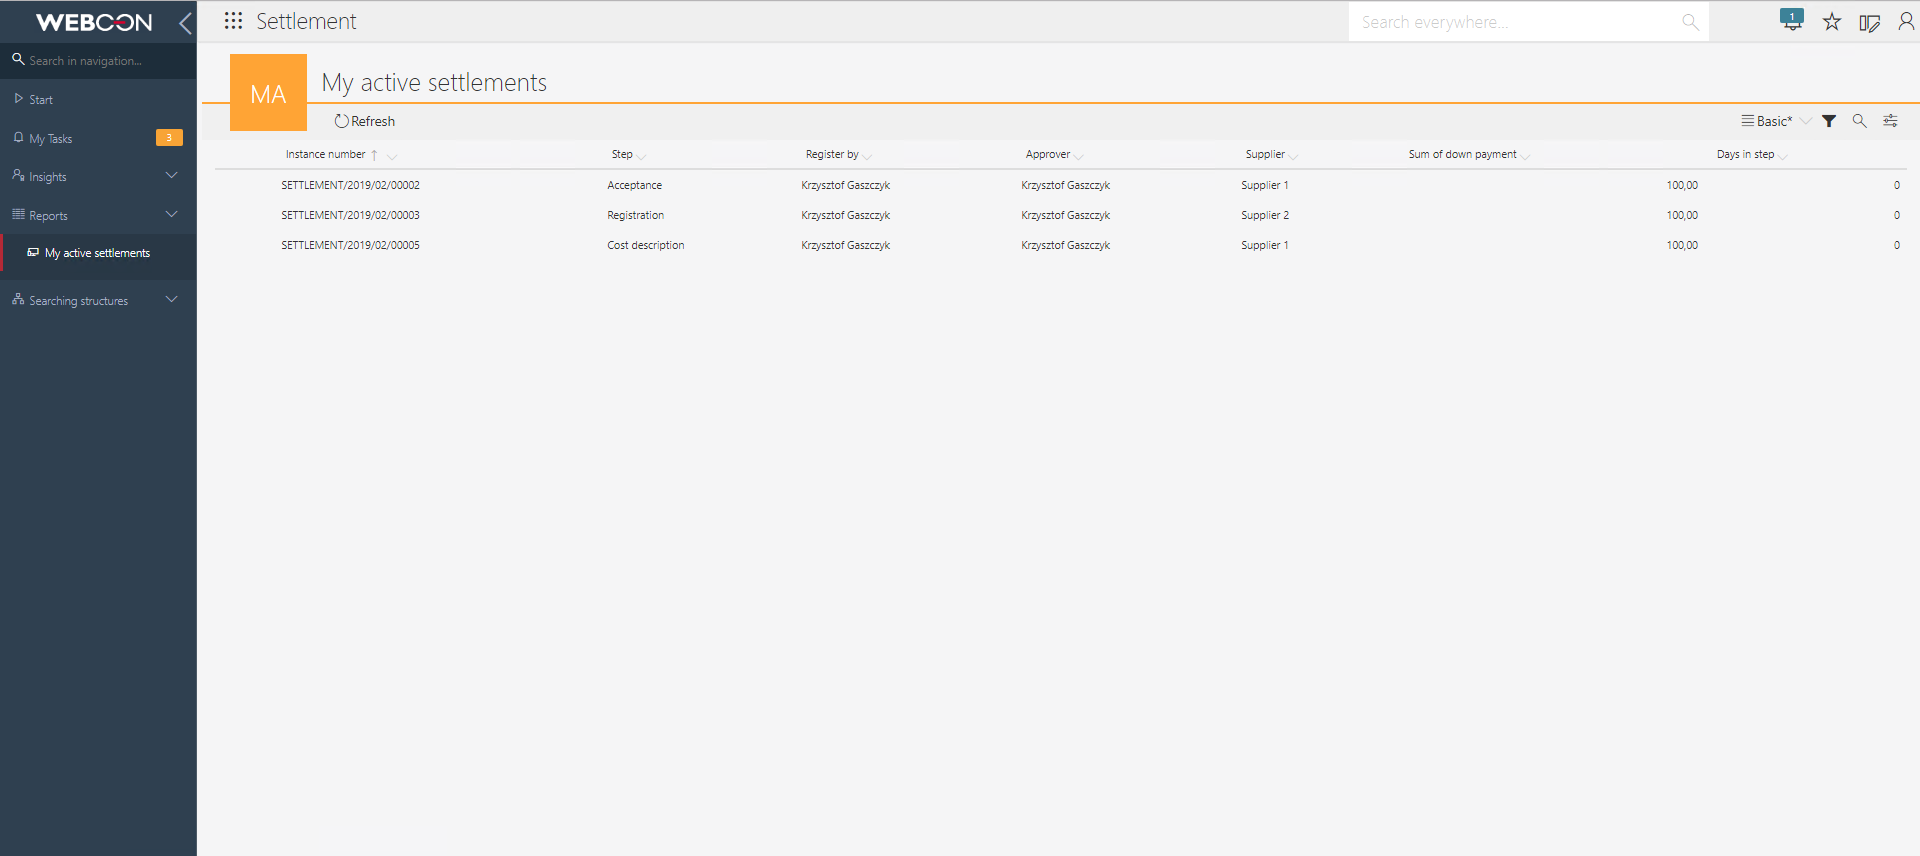
This is how a report of active user tasks together with views for each step is created. By default, the system includes a “My tasks” inbox. However, if a task on a specific step will be given to a group of users and one of them will open it through the inbox, then the system will lock it for the time of editing. If using the report, the system will not lock such a task. Below you can see the general report
Summary
WEBCON BPS offers you an easy and intuitive way of creating reports for system tasks; it can be done on Portal or in Designer Studio. For the user’s convenience, both configurations look alike.
There are numerous options for configuring reports and filtering their data. Also, every user can filter the reports to suit their needs and save their private view for later use. Thanks to this, you can provide your users with a default view containing the essential information and allow them to customize it if they find it helpful.

