Hello all,
I'm trying to set up a report like the one in this article: https://community.webcon.com/posts/post/new-features-of-charts-in-reports/333/35
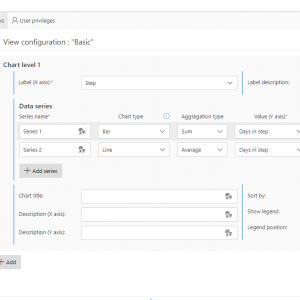
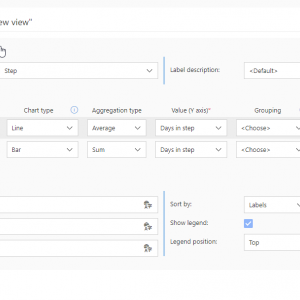
where I want to combine a Bar chart with a Line one but I keep having errors on the rendering of the report.
I want to show the sum of days in each step of the process (Bar chart) and the average Day(s) in step as a Line chart.
This is not working.
I don't have any filters, nor calculated columns. I've tried to create a chart with another field to check if the issue is related with Day(s) in step field, still I get the error.
Does anyone configured something like this?
Thank you
Reports with Chart combining Line & Bar not working
Hi Andreia,
what kind of error do you have?
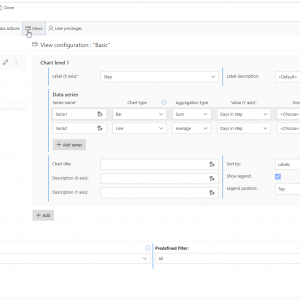
I prepared a chart according to your screenshot and it works correctly
Hi Jack,
How does it look like in the report?
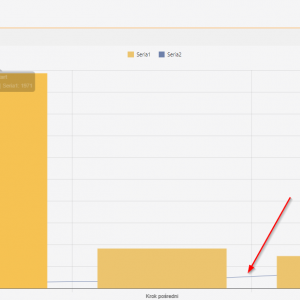
I'm not sure what I was doing wrong, the report worked now, however the line for average is not very visible as the report does not adjust to see something like the last chart in the Webcon link.
Hi Jack,
How does it look like in the report?
I'm not sure what I was doing wrong, the report worked now, however the line for average is not very visible as the report does not adjust to see something like the last chart in the Webcon link.
unfortunately it doesn't look spectacular (the line is barely visible), but it seems to work ;)
unfortunately it doesn't look spectacular (the line is barely visible), but it seems to work ;)
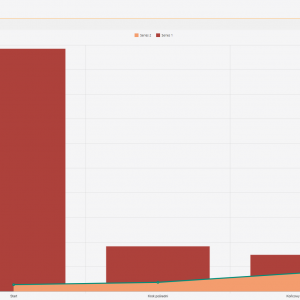
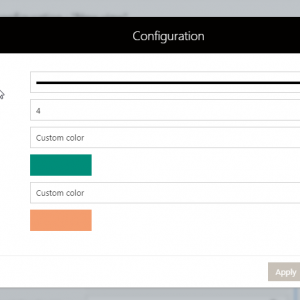
after playing with styles the line looks a bit clearer
--- EDIT ---
and the bar/line order makes a difference
after playing with styles the line looks a bit clearer
--- EDIT ---
and the bar/line order makes a difference
To specify how the order influences result.
Chart elements are based on the order - first place means it will be rendered at the top 'layer', and last place means it will be rendered at the bottom, so everything will overdrawn by another elements.
To specify how the order influences result.
Chart elements are based on the order - first place means it will be rendered at the top 'layer', and last place means it will be rendered at the bottom, so everything will overdrawn by another elements.
Thank you both!
Yes it doesn't look very clear and pretty. Plus the configuration and order, I have duration steps to high and the line becomes very close the X axis, still it was very helpful for the next configurations!
Thank you!

