Gantt absence chart on the Modern form
Applies to version: 2020.1.x and above; author: Daniel Półchłopek
Introduction
In version 2020, the ability to present absences of employees in the form of the Gantt chart has been added to the Modern form. Until now, this form field was available only on the SharePoint form.
One of the examples is displaying the employee's approved leaves in the absence process, but there are more possibilities - the process described below allows you to manage employees from the level of the production line.
Application
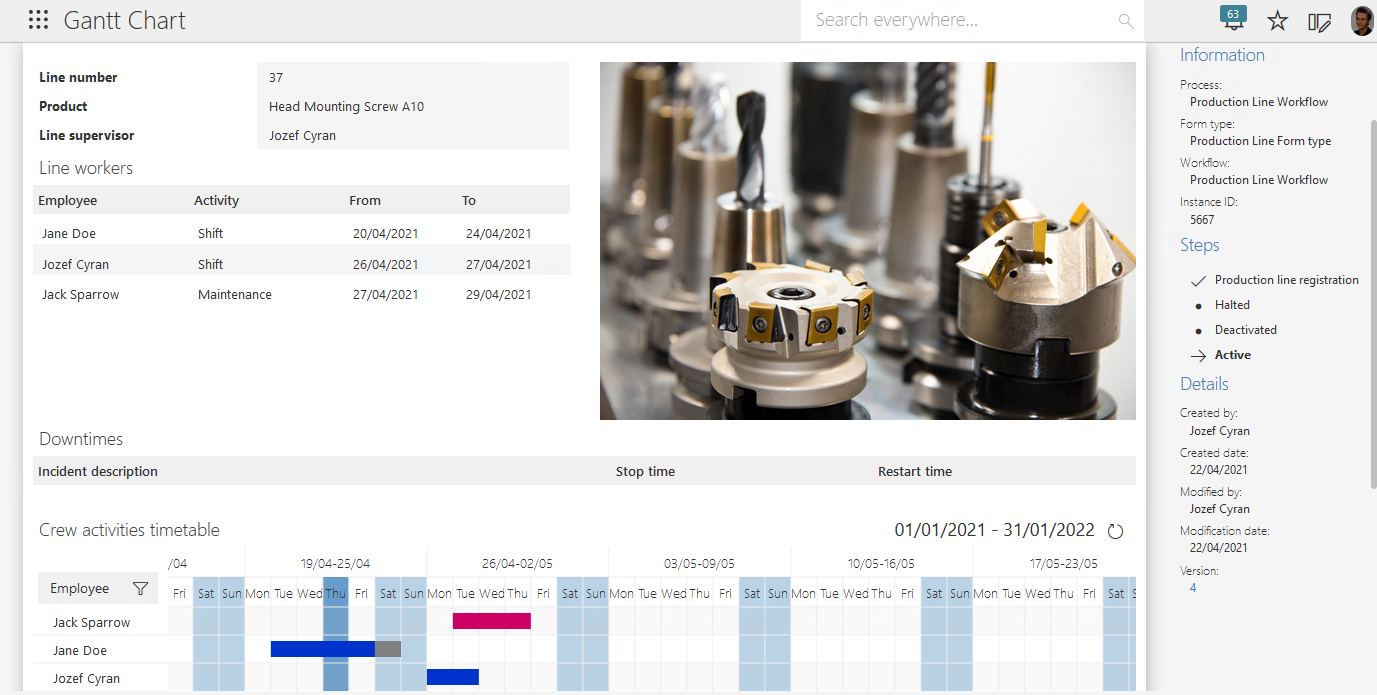
At the first step, a line supervisor assigns tasks to employees, completes necessary data (such as line number and production type), and starts an instance.
Fig. 1. An example application instance
At the “Active” step, the following paths are available:
- Save line workers - used to save changes
- Deactivate production - used to deactivate the production line
- Halt production - used to hold production
Fig. 2. The Gantt chart presenting employees assigned to a given line
The final appearance of the application with a list of downtimes (date and time of stopping and restarting the production) and the Gantt chart is presented below.

FIg. 3. The Downtimes item list
Application workflows
The Production Line Workflow is used to supervise the production line e.g. in a factory. Each instance of this workflow represents a single line – each of them has its supervisor who can assign a task to employees and define a duration (in days). Additional paths in the workflow allow you to stop or deactivate the production line.
The second workflow is auxiliary – its instances present individual employees’ tasks at a given position (line).
Main workflow

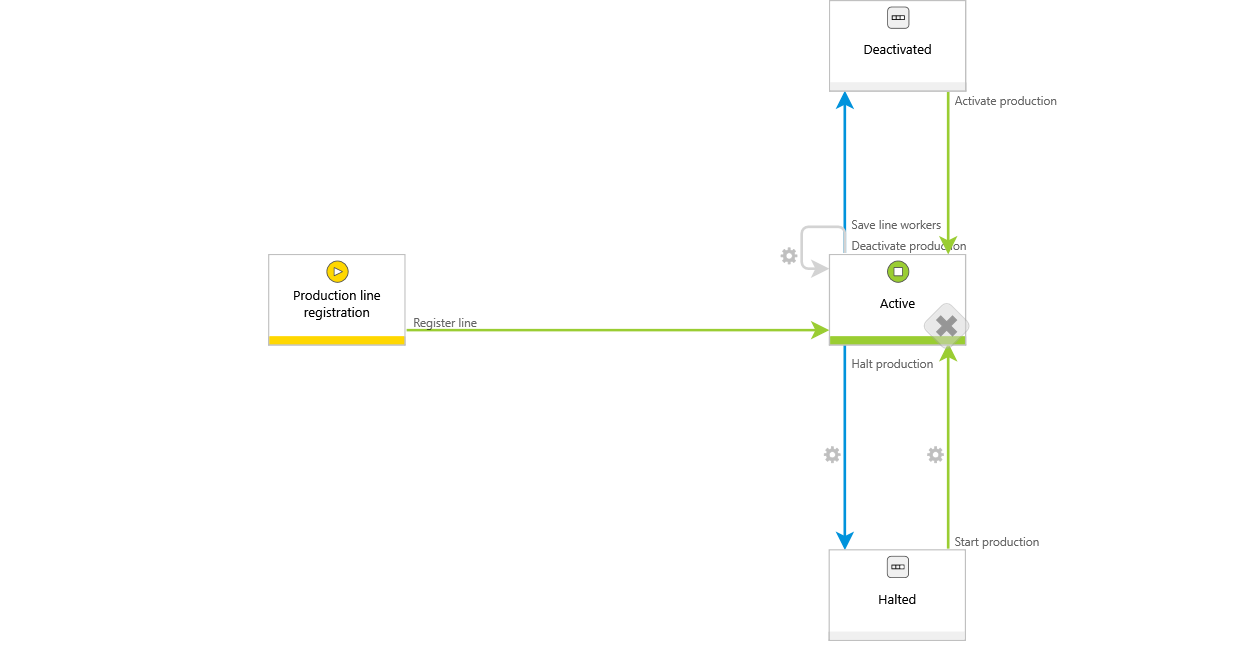
Fig. 4. Main workflow diagram
During registration, the supervisor fills out the necessary information and defines the duties for employees. When a production line is Active, the supervisor can edit an instance (and then save), deactivate a line, or halt the production. By going through a path to the Halted step, the system will automatically register the stop time. A reason must be entered after the downtime is finished.
Auxiliary workflow - configuration and description

Fig. 5. The auxiliary workflow
Each Gantt chart must be connected to the absence process. The Absence types source must contain all absence types (and in the case of the described application, all types of activities displayed on the Gantt chart).
Fig. 6. A query returning absebce types
The names of the returned columns are as in the query above:
- VACType_ID --> ID of the absence/activity (must be unique) *required
- VACType_ColorID --> specifies the color of the bar on the Gantt chart *required
- VACType_Name --> absence name *required
- VACType_Description --> absence/activity description after hovering over it with the mouse *not required
- VACType_TakeAvailableDays --> specifies whether the absence/activity should take the available absence days *not required
The data source for Absence Types can be any as long as the column names are identical to the above.
Main workflow configuration
In addition to the form fields containing information about the production line (Line number, Product, Line supervisor), the process also contains two item lists. The first list Downtimes is automatically filled with the “Change items list values” action when a user goes through the Halt production path. This path follows the Halted step, and upon restarting – the supervisor must provide the reason for stopping the production.
Fig. 7. Providing the reason
The second item list contains a list of employees along with a list of duties defined by the supervisor, and the type of work performed.

Fig. 8. Employees with duty hours asigned
The “Save line workers” path contains two actions – Updating_Line workers ID (saving employees’ IDs) and Start activity workflows.

Fig. 9. The configuration of the action
The “Start activity workflow” action starts workflows for each employee on the item list.
Fig. 10. A query that sends data to the sub-workflow

Fig. 11. Limitation excluding the duty hours for which the sub-workflow has been started
Gantt chart configuration
Go to the advanced configuration of the Gantt chart form field. In the Basic tab, select the process – in this case it will be Employee activities. You can also select the steps presented on the chart.
Fig. 12. The Basic tab
The next step is to select the employees presented on the chart. As in the case of the Gantt chart, you can select:
- The approver and their subordinates
- The ID of the person to be included in the chart
Fig. 13. The Employees tab
To indicate the supervisor and employees IDs, the _Line workers ID form field was created. If you need to indicate more than one person – create a string with IDs of employees separated by a semicolon (;)
For this purpose, the action of changing the field value (the semicolon is added to the ID of the line supervisor) and the Collection function (that returns the values from the SQL query separated by a semicolon) have been added.
Fig. 14. The rule selecting employees to display
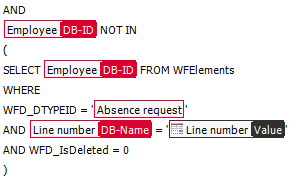
The SQL query shown below selects the ID of the line employees:
Fig. 15. The SQL query returning employees to the default value
In the next tab, you can indicate the date range – whole year, the period from the current date to the end of the calendar year, and the specified number of next and previous months.
Fig. 16. The Date range tab
The next tab allows you to configure additional settings. It is possible to:
- Show date range
- Show chart key (a legend informing about available leave/activities types)
- Show field name
- Automatically expand employees tree
- Select simplified presentation
Fig. 17. The Display settings tab
The last tab is used to indicate which summary columns should be visible on the chart. For typical absence applications, it makes sense to display the number of available and used vacation days.
Fig. 18. The Summary columns tab

