KPI in Portal - how to analyze instance’s time in step and edit time to improve business processes
Applies to version: 2020.1.x and 2021.1.x; author: Dawid Golonka
Introduction
This article explains how to enable the analysis functionality in WEBCON BPS Designer Studio 2020. When you edit a step in Designer Studio, you can open the "Analysis" tab to see how long the instances were staying at a given step and how much time was spent editing them.
Thanks to this, you have the information you need to improve your bpm workflow. For example, it is possible to check whether some employees spend too much time performing a task assigned to them. This will help you identify bottlenecks in your processes and take steps to bring task execution times in line with the expected parameters (e.g., by making the form more intuitive and adding tooltips).
You can also set the expected time for the instance to stay at a given step and the time that can be spend editing it, giving the employees useful information about the deadlines.
System settings
The analysis is generated via BPS service. There, you need to enable the “Basic features” option to use it. Go to the System settings -> Service configuration -> Services, select the appropriate Service, and check the "Basic features" option.
After expanding this menu, go to the “Services” submenu and select your Service. The screenshot below shows the view in Studio after following this path. Check the box next to “Basic features”.
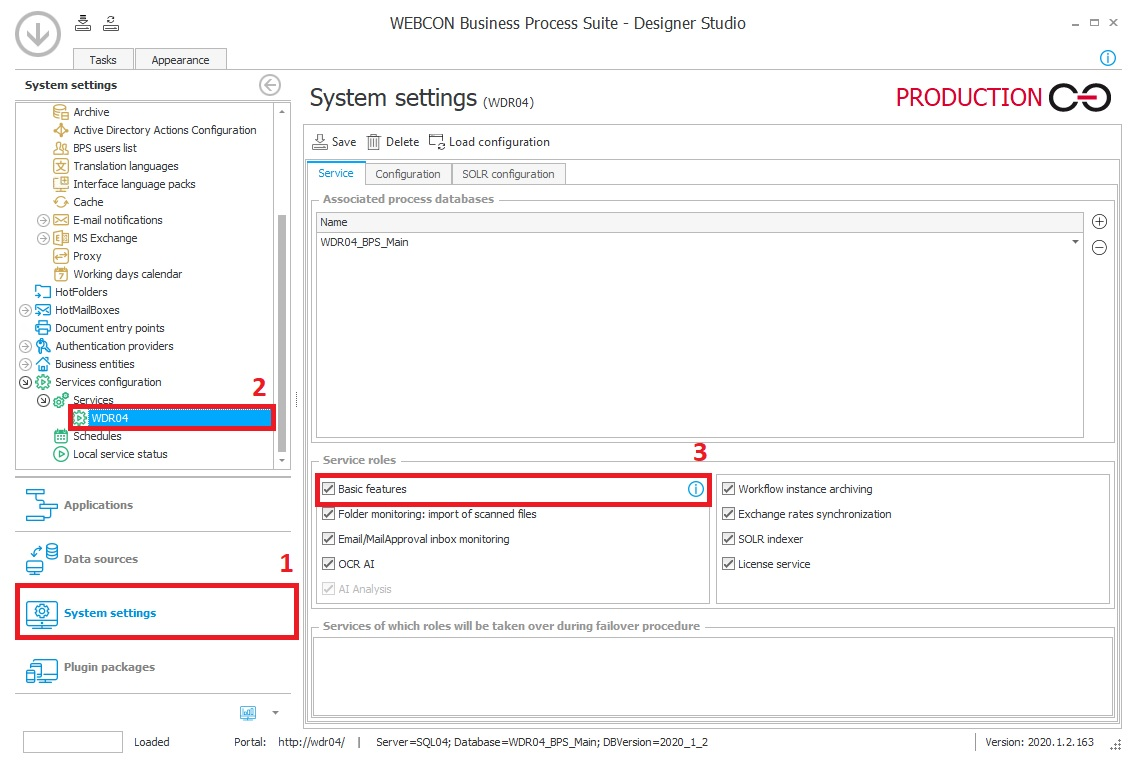
Fig.1. Service configuration.
Data update takes place only at times selected by the user. To define the update hours, look at the menu on the left and select "Schedules." It should be right below your Service (see figure 2 for BPS version 2020, and number 3 for version 2021).
In the “KPI time refresh”, indicate the hours in which the statistics will be updated. Updating analysis can be a burden to the database - therefore, it is recommended to set the update outside of working hours. After introducing new hours, confirm them by pressing the “Save” button (number 3 in the figure) in the program interface's upper part.

Fig.2. Schedule configuration - BPS 2020.
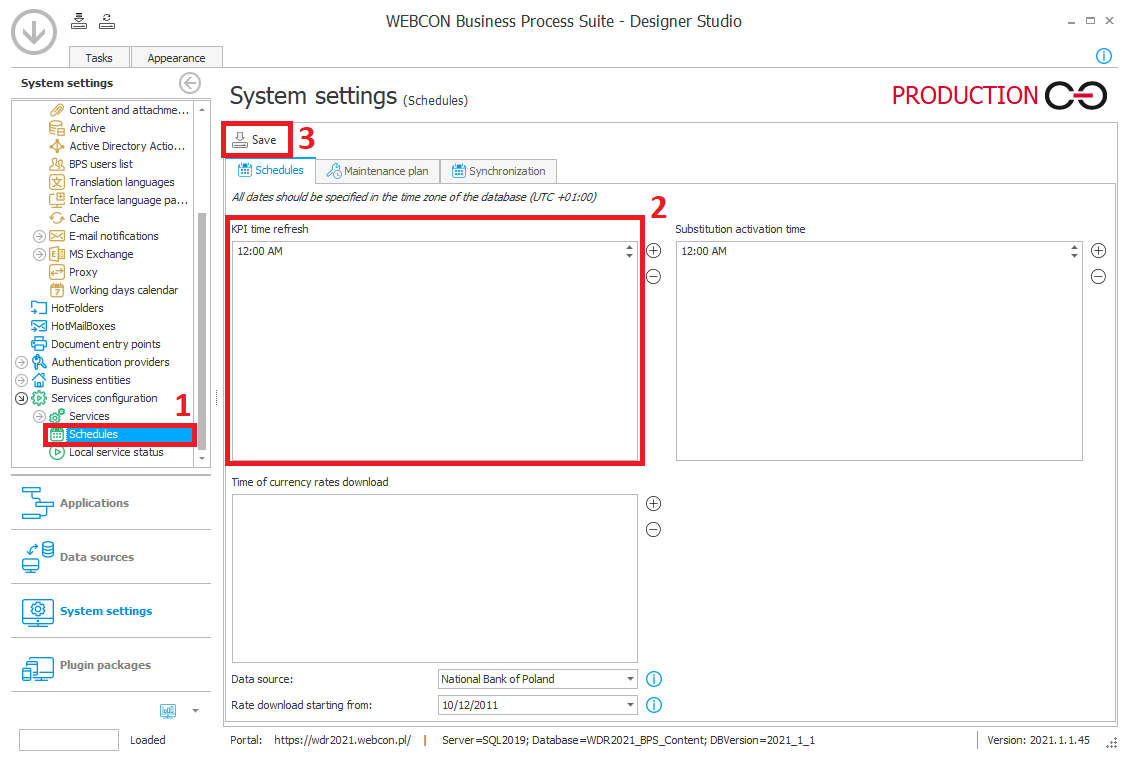
Fig.3. Schedule configuration - BPS 2021.
After saving, it will be necessary to reload the Service settings. To do this, go back to your Services configuration and click the “Load configuration” button on the top bar.
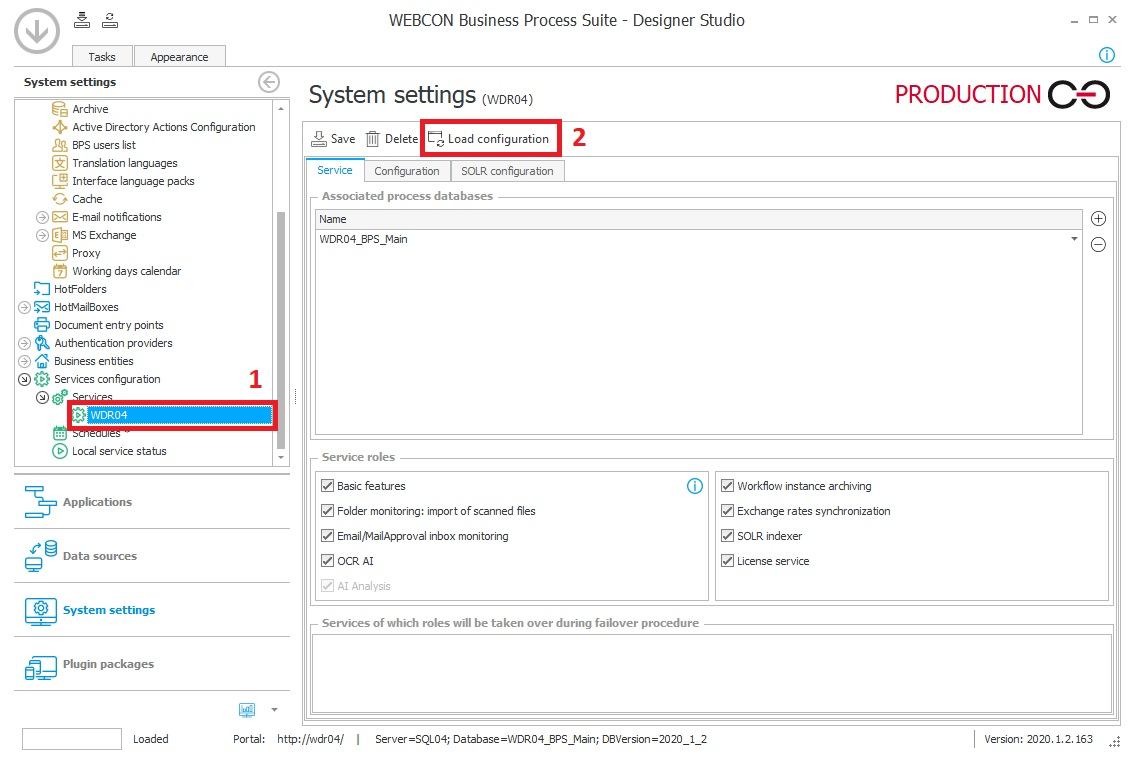
Fig.4. Loading the service configuration.
Workflow configuration
To present this functionality, we have created a sampleworkflow consisting of 5 steps. This workflow will be used to accept requisitions submitted by employees. The approvers will be the superiors on two levels.
In the “Request registration” step, the requisition will be registered. In the “Acceptance I” step, the requisition will be accepted or rejected by the team leader. The manager will be able to accept or reject the request in the “Acceptance II” step.

Fig.5. Sample workflow.
In this process, the instance is edited only at the first step (request registration). The acceptance step consists only of accepting or rejecting the request, which is done by following the appropriate path.
We can set the expected time the instance will be in a given step and the expected edit time - to do this, go to the “Analysis” tab in the editing panel of a given step.

Fig.6. Setting the expected time for an instance to stay in a given step and be edited.
For the purpose of our example, we will set estimated stay and edit time for instances at the “Acceptance I” and “Acceptance II” steps:
“Acceptance I” step:
- Expected time in step - 1 [h]
- Expected edit time - 120 [s]
“Acceptance II step”:
- Expected time in step - 1 [h]
- Expected edit time - 180 [s]
When BPS Service finishes the first statistical data update at the hour we have indicated earlier, the fields "Time in step statistics" and "Edit statistics "will be filled in as shown in the figure below:
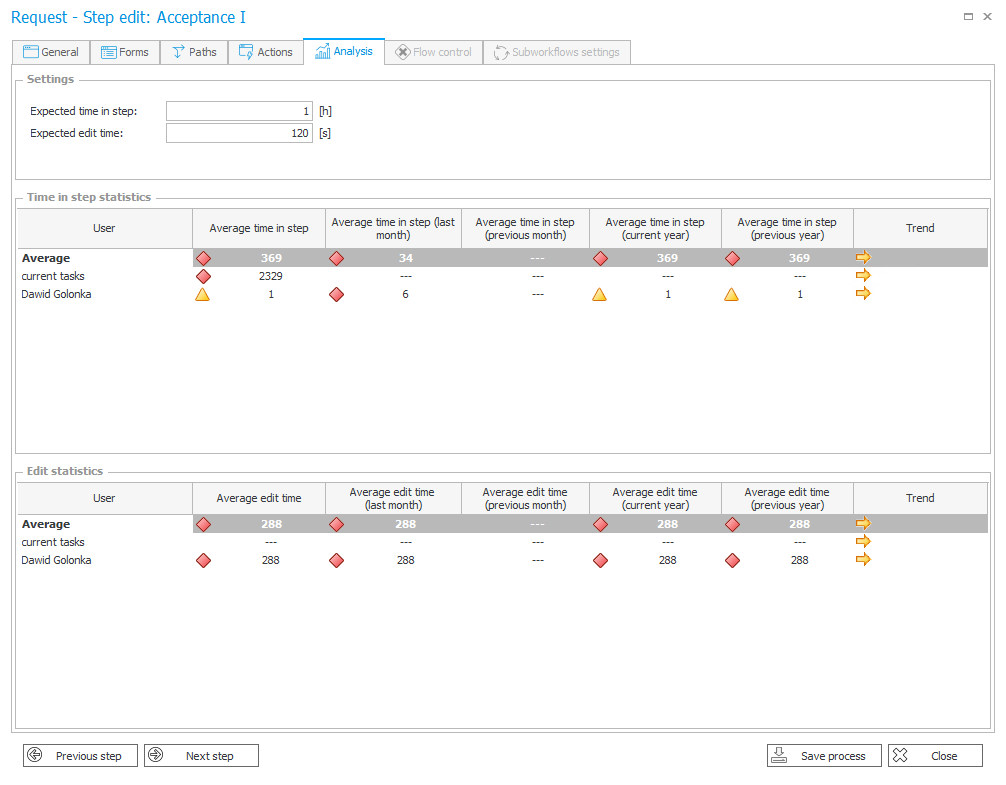
Fig.7. Statistics at "Acceptance I" step
In figure 7, you can see instances’ time in step and edit time for individual employees, the average time, and the trends. The "Trend" column tells you how the columns' value has changed between the previous month and the current month:
![]() Shorter time than in the last month.
Shorter time than in the last month.
![]() Comparable time to the last month.
Comparable time to the last month.
![]() Longer time than in the last month.
Longer time than in the last month.
Apart from listing time for particular employees, the statistics return a row with “Current tasks." This is the average duration (days in step) of all uncompleted tasks.
KPI Report
Starting with WEBCON BPS 2020.1.3, it is possible to add a KPI report to Portal (see figure 8 below).

Fig.8. Adding a KPI report to Portal.
When you create a new report, name it and choose the source (workflow) from which the statistics should be taken (figure 9 below).

Fig.9. Report source selection.
In the column selection tab, indicate the report columns, sorting, and mode. The available modes are:
- step duration statistics in hours,
- step duration statistics in days,
- statistics for time spent editing.
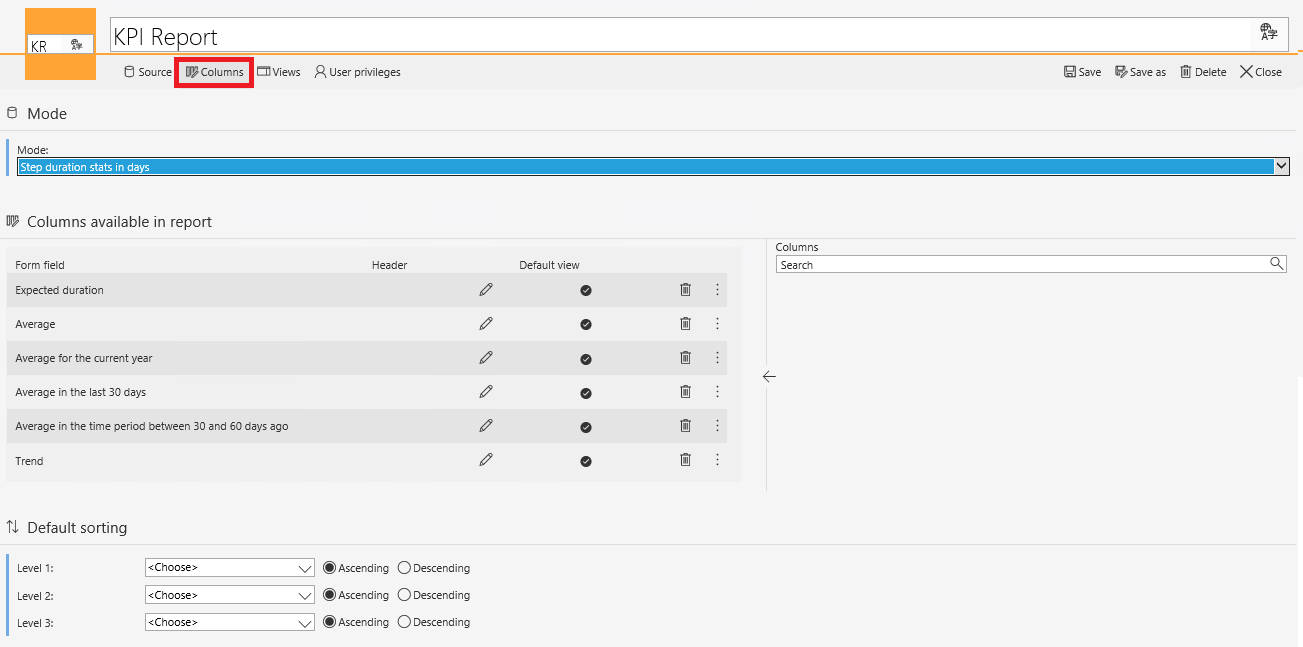
Fig.10. Choosing columns and report mode.
In the following tabs, you can define report display views and permissions.
In the “Views” tab, under “Miscellaneous”, you can turn on a color legend (“Show legend”) to make it easier for users to read the report.

Fig.11. Enabling the legend.
The newly created KPI statistics report looks like this:

Fig.12. KPI statistics report on Portal.
The legend mentioned above explains the meaning of the markers that may appear on the report. Meaning of the meantime columns:

Fig.13. Marks for meantime columns.
Marks for trend columns.

Fig.14. Marks for trend columns.
Technicalities and additional information
- KPI reports are mainly based on data stored in the WFHistoryElements table. The key fields in this table for KPI calculations are:
- WFH_LeftBy - information who completed the task,
- WFH_DurationInStep - time in a given step,
- WFH_FormEditDurationToLeave - editing time in a given step.
- Reports also use data stored in the WFElementTasks table.
- By running synchronization in BPS Studio (as shown in Figures 2 and 3), we enable the collection of data related to statistics to the “AnalyticsSteps” and “AnalytiscUsers” tables.
- The data regarding the expected time in step and edit time for an instance is stored in the columns of the step configuration table (WFSteps - columns “STP_ExpectedAvgStepDurationByHours” and “STP_ExpectedAvgEditDurationBySec”).
- The report, which is the subject of this article, is created through a properly prepared SQL query, operating mainly on the tables mentioned above.
- The report supports translations; the names of processes, workflows, and steps can be translated.
- The KPI report supports filtering, but it does not support grouping and breaking the results into pages.
Summary
The analysis of statistical data at individual steps allows drawing conclusions that can improve the efficiency of business processes. For example, it can enable:
- Finding places where editing the form is more time-consuming than expected. This can be an incentive to reorganize the form.
- Comparing the editing time of a revised form to evaluate the changes made to it.
- Finding bottlenecks, i.e., places where an employee spends too much time at their task preventing the instance from going to another workflow step. Then, the cause of such a situation can be analyzed.
- Comparing expected form editing time and days in step with the results obtained in everyday work. If they differ, corrections can be made.

