Integration with Microsoft Sentinel
Applies to version: 2025 R1 and above; author: Łukasz Maciaszkiewicz
Introduction
The 2025 R1 version of WEBCON BPS introduces support for SIEM (Security Information and Event Management) providers. This article explains how to integrate the WEBCON BPS platform with a SIEM service using the Microsoft Sentinel tool.
What is SIEM?
The SIEM (Security Information and Event Management) system manages security-related information and events. The system operates by monitoring and correlating data from various sources, generating reports, and issuing warnings about suspicious activities. As a result, the system provides invaluable support to specialists responsible for analyzing data and countering threats.
Microsoft Sentinel
The correct integration of the Microsoft Sentinel service with the WEBCON BPS platform requires delivering complete logs and application data to the former. The Azure Monitoring Agent facilitates the transmission of such information using the OpenTelemetry standard. In this scenario, the data transmitted from WEBCON BPS is collected in the Application Insights app, specifically in the Log Analytics workspace. To utilize this data in Microsoft Sentinel, it is necessary to configure both the OpenTelemetry tool and the connection between the Microsoft Sentinel service and the aforementioned workspace.
- Configuration in the Azure platform
It is a good idea to start the configuration in the Azure platform by creating a Log Analytics workspace, and then proceed to create the Application Insights app.
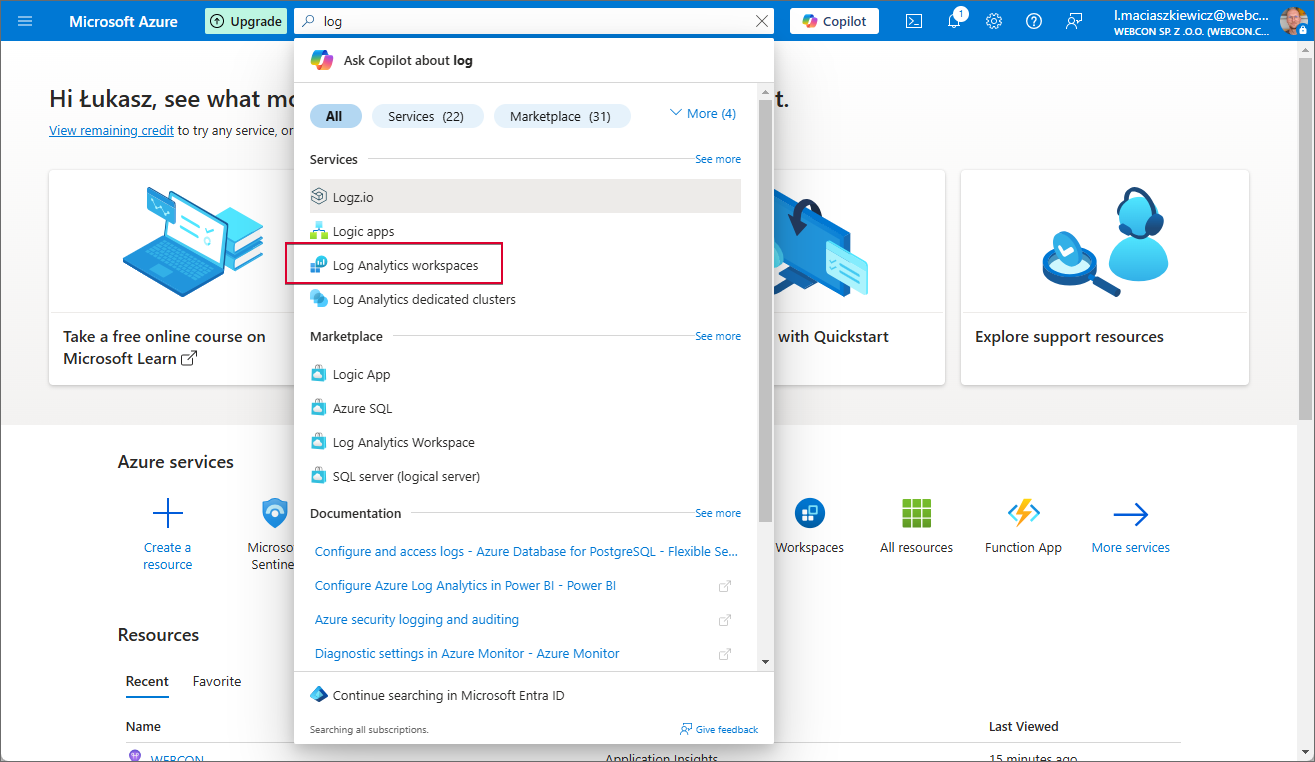
To do this, after logging into the Microsoft Azure platform (https://azure.microsoft.com/en-us/get-started/azure-portal/), use the search box at the top of the window to search for and select Log Analytics workspace.
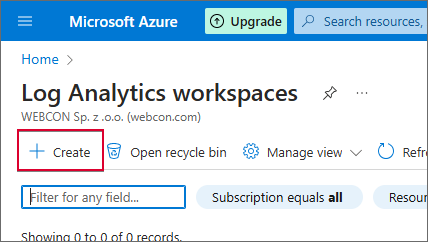
To create a new workspace, click the Create button in the upper right corner of the newly opened window.
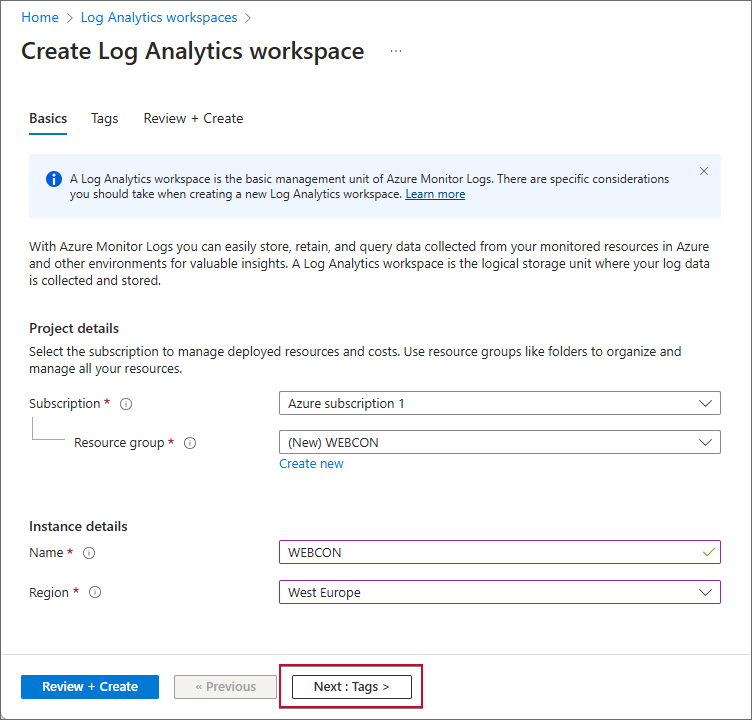
In the workspace configuration window, select the appropriate subscription type in the Subscription field, and create a new resource group by clicking the Create new button in the Resource group field. After entering the name of the new group and confirming it by clicking the OK button, navigate to the Instance details section. Enter the instance name in the Name field, and select West Europe in the Region field. Once you fill out these fields, proceed to the next tab by clicking the Next : Tags > button.
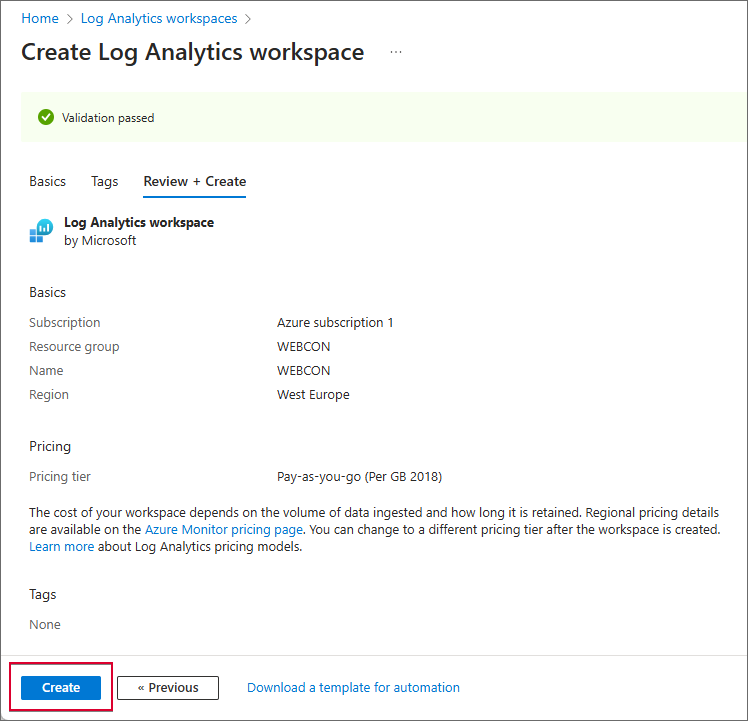
The Tags tab enables users to add tags for categorizing resources. However, in this scenario, this operation is not required and can be skipped – click the Next : Review + Create > button to proceed to the data validation window. After verifying the data, a confirmation message is displayed, and the workspace can then be created. To do this, click the Create button located in the upper-right corner – the workspace will be created shortly afterward.
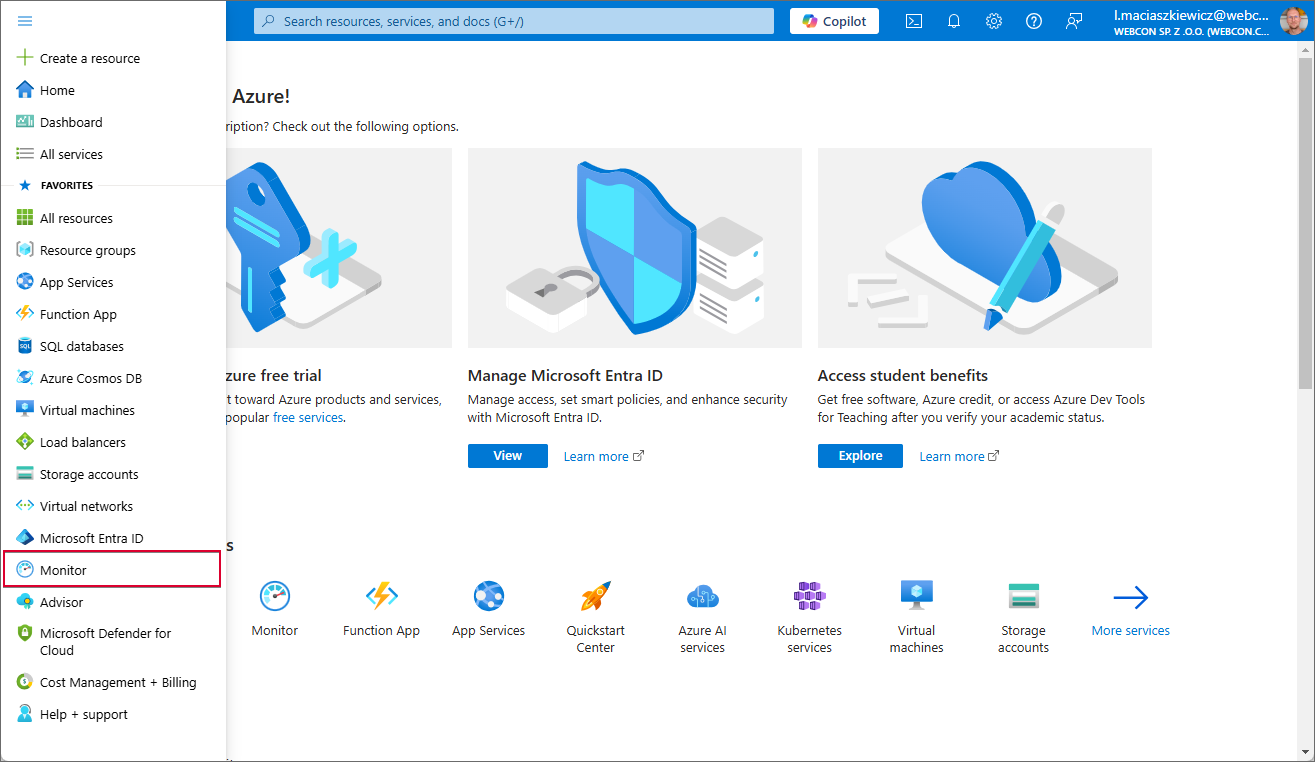
After creating the workspace, proceed to add the Application Insights app. To do this, use the Monitor option located in the side menu.
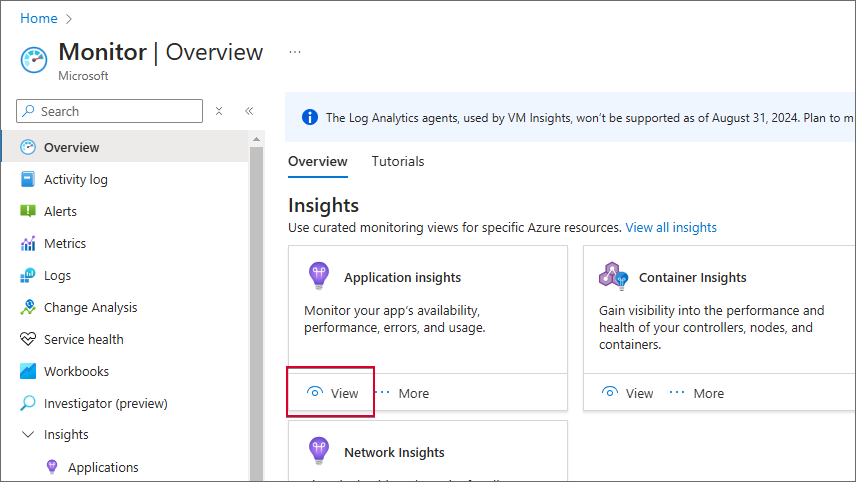
Once the new window opens, go to the Insights section, find the Application Insights tile, and click the View button.
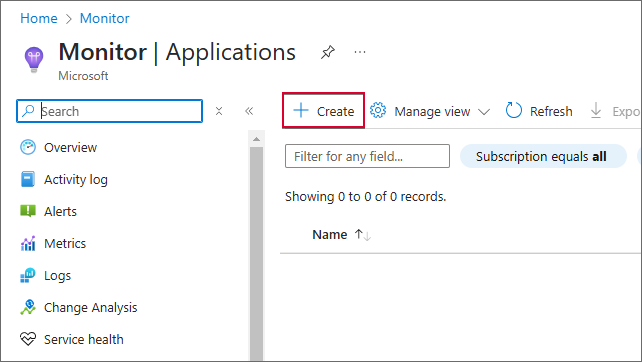
To create a new app, click the Create button in the upper-right corner of the window.
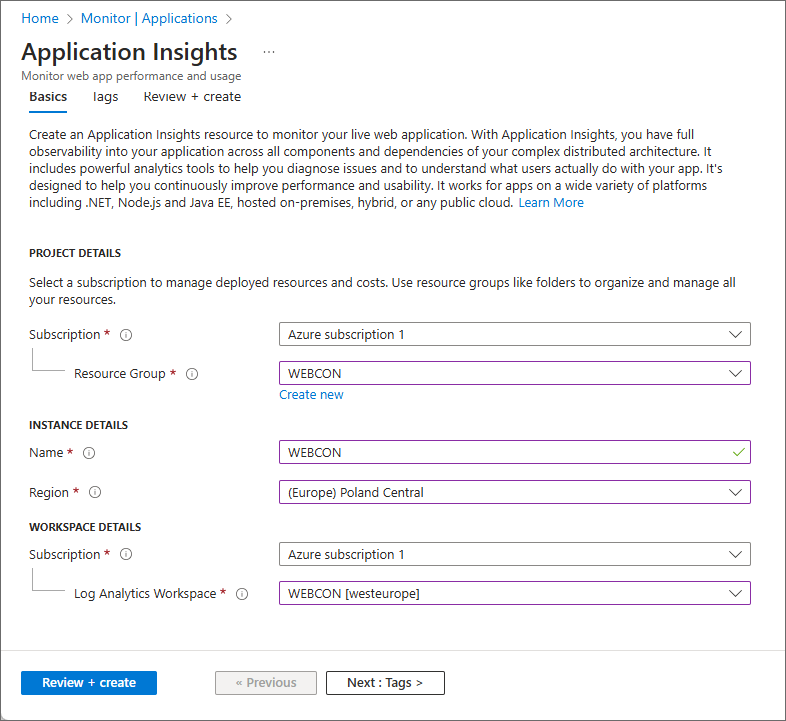
In the Project details section of the new window, define the subscription type in the Subscription field. Then, in the Resource Group field, select the resource group created when setting up the Log Analytics workspace (in this case, the “WEBCON” group).
In the next section (Instance details), enter the instance name in the Name field, and select (Europe) Poland Central in the Region field. After entering the aforementioned data, navigate to the Workspace details section, define the relevant subscription type in the Subscription field, and select the previously created Log Analytics workspace in the field below.
Once you complete the configuration, navigate to the Review + create tab by clicking Next : Tags >, then Next : Review + create >, and finally click the Create button in the bottom left corner. When the application is successfully created, a confirmation message is displayed.
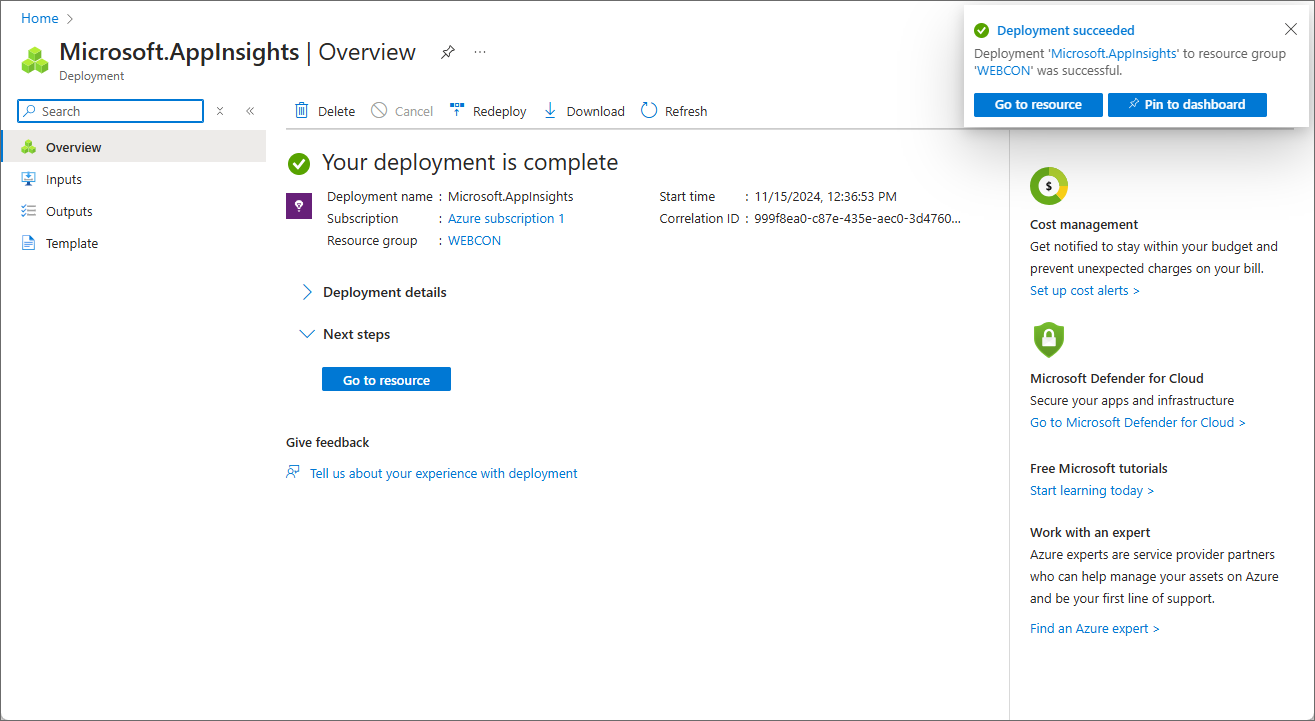
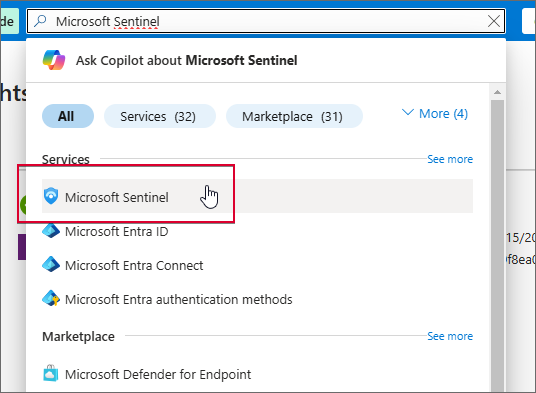
With the Application Insights app and the workspace created, you now need to connect it to the Microsoft Sentinel tool. Search for the tool and select it from the search box.
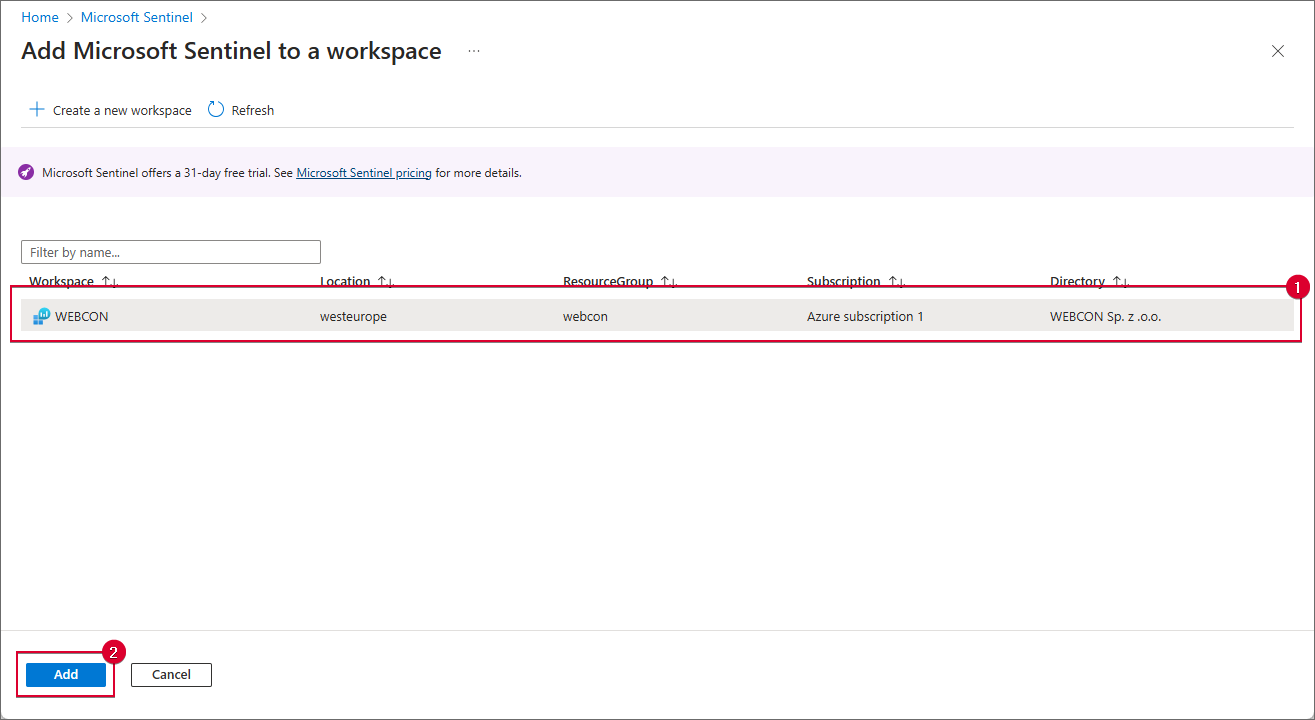
Click the Create button in the upper-right corner of the newly opened window. As a result, a window opens where you can add the Microsoft Sentinel tool to the previously created Log Analytics workspace. Select the relevant item from the list and click the Add button in the bottom-right corner.
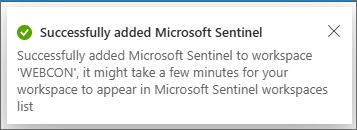
A message is displayed in the upper-right corner of the new window, confirming the successful addition of the Microsoft Sentinel tool to the workspace.
After completing the configuration in the Azure platform, you can proceed to configure the OpenTelemetry tool.
- Configuration of the otlpsettings.json file
To enable data transmission to Application Insights, a new object, AzureMonitor, has been added to the OpenTelemetry configuration file, i.e., otlpsettings.json. This applies to both the file included in the Portal and the Service component directory of the WEBCON BPS platform. The aforementioned object is included in the Exporters section under both the Metrics and Tracing nodes.
This article discusses only the configuration of the Portal’s otlpsettings.json file. However, please note that the procedure is identical for the Service’s file as well.
To enable the AzureMonitor exporter, open the otlpsettings.json file located in the Portal’s directory (by default: C:Program Files (x86)WEBCONWEBCON BPS Portal). In the Metrics node, locate the Exporters section and find the AzureMonitor object which contains two fields: Enabled and ConnectionString. Start by changing the value of the Enabled field to “true”.
NOTE: to enable data export for the AzureMonitor object, in addition to setting the value to “true” in the Enabled field, it is also necessary to configure its parent nodes in the same way. This means that, in the discussed scenario, users must change the values of the Enabled fields in the Otlp, Metrics, and Exporters nodes, respectively.
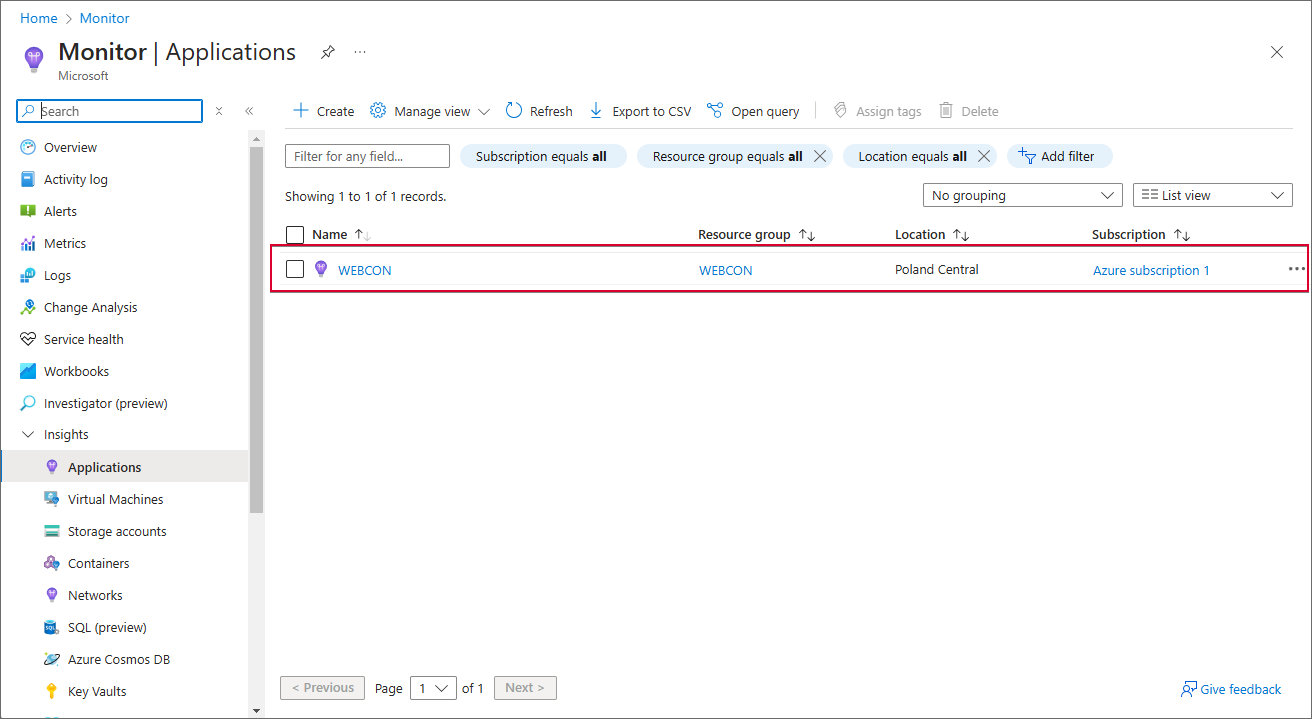
Next, go to the ConnectionString field. Here, enter the connection string within the existing quotation marks. The value for this parameter can be found in the previously configured Application Insights app. To find it, navigate to the Azure platform. From the side menu, select the Monitor option, then click the View button in the Application Insights tile. Once a new window opens, select the previously configured app from the list of available applications (in this case, “WEBCON”).
In the new window, copy the value from the Connection String field.
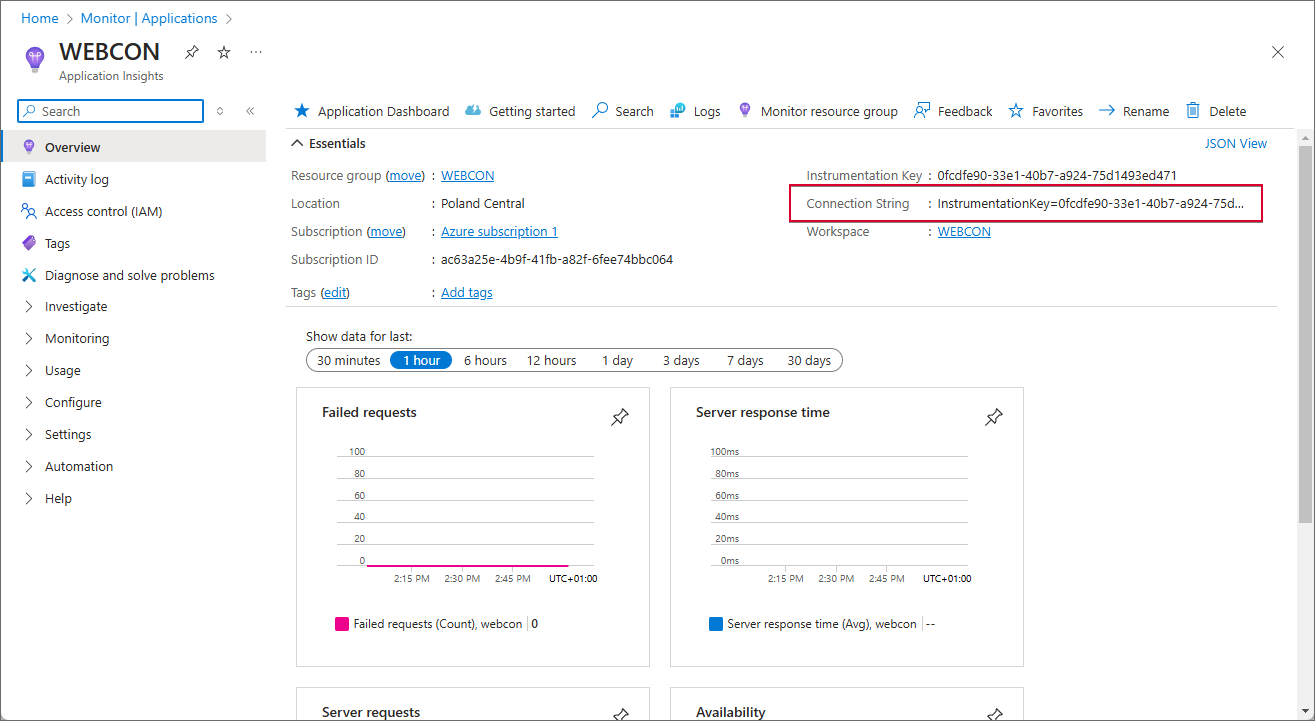
Insert the copied value into the ConnectionString field of the otlpsettings.json file, ensuring you remove the entire default value, including the square brackets, beforehand. The connection string value should be entered within the quotation marks.
Repeat the steps described in this section in the Tracing node and save your modifications. Once modified, the file should appear as follows:
|
{ "App": { Otlp": { "ServiceName": "WebCon.WorkFlow.Portal", "Enabled": true, "Metrics": { "Enabled": true, "WebInstrumentation": { "Enabled": true }, "ProcessInstrumentation": { "Enabled": true }, "EventCountersInstrumentation": { "Enabled": true, "EventSources": "Microsoft.AspNetCore.Hosting, System.Net.Http" }, "Exporters": { "Prometheus": { "Enabled": true, "Endpoint": "/metrics", "CacheDuration": 100 }, "otlp": { "Enabled": false, "Endpoint": "[metricsAddress]", "Headers": "Authorization=[apikey]" }, "AzureMonitor": { "Enabled": true, "ConnectionString": "InstrumentationKey=<Instrumentation_Key_Value>" } } }, "Tracing": { "Enabled": true, "ShowExceptions": true, "HttpTracing": { "Enabled": true }, "SqlTracing": { "Enabled": true, "ShowDbStatements": true }, "Exporters": { "Jaeger": { "Enabled": true, "Endpoint": "http://[jaegerAddress]:4317", "Protocol": "grpc" }, "Otlp": { "Enabled": false, "Endpoint": "[tracingAddress]", "Headers": "Authorization=[apiKey]", "Protocol": "grpc" } }, "AzureMonitor": { "Enabled": true, "ConnectionString": "InstrumentationKey=<Instrumentation_Key_Value>" } } } } } |
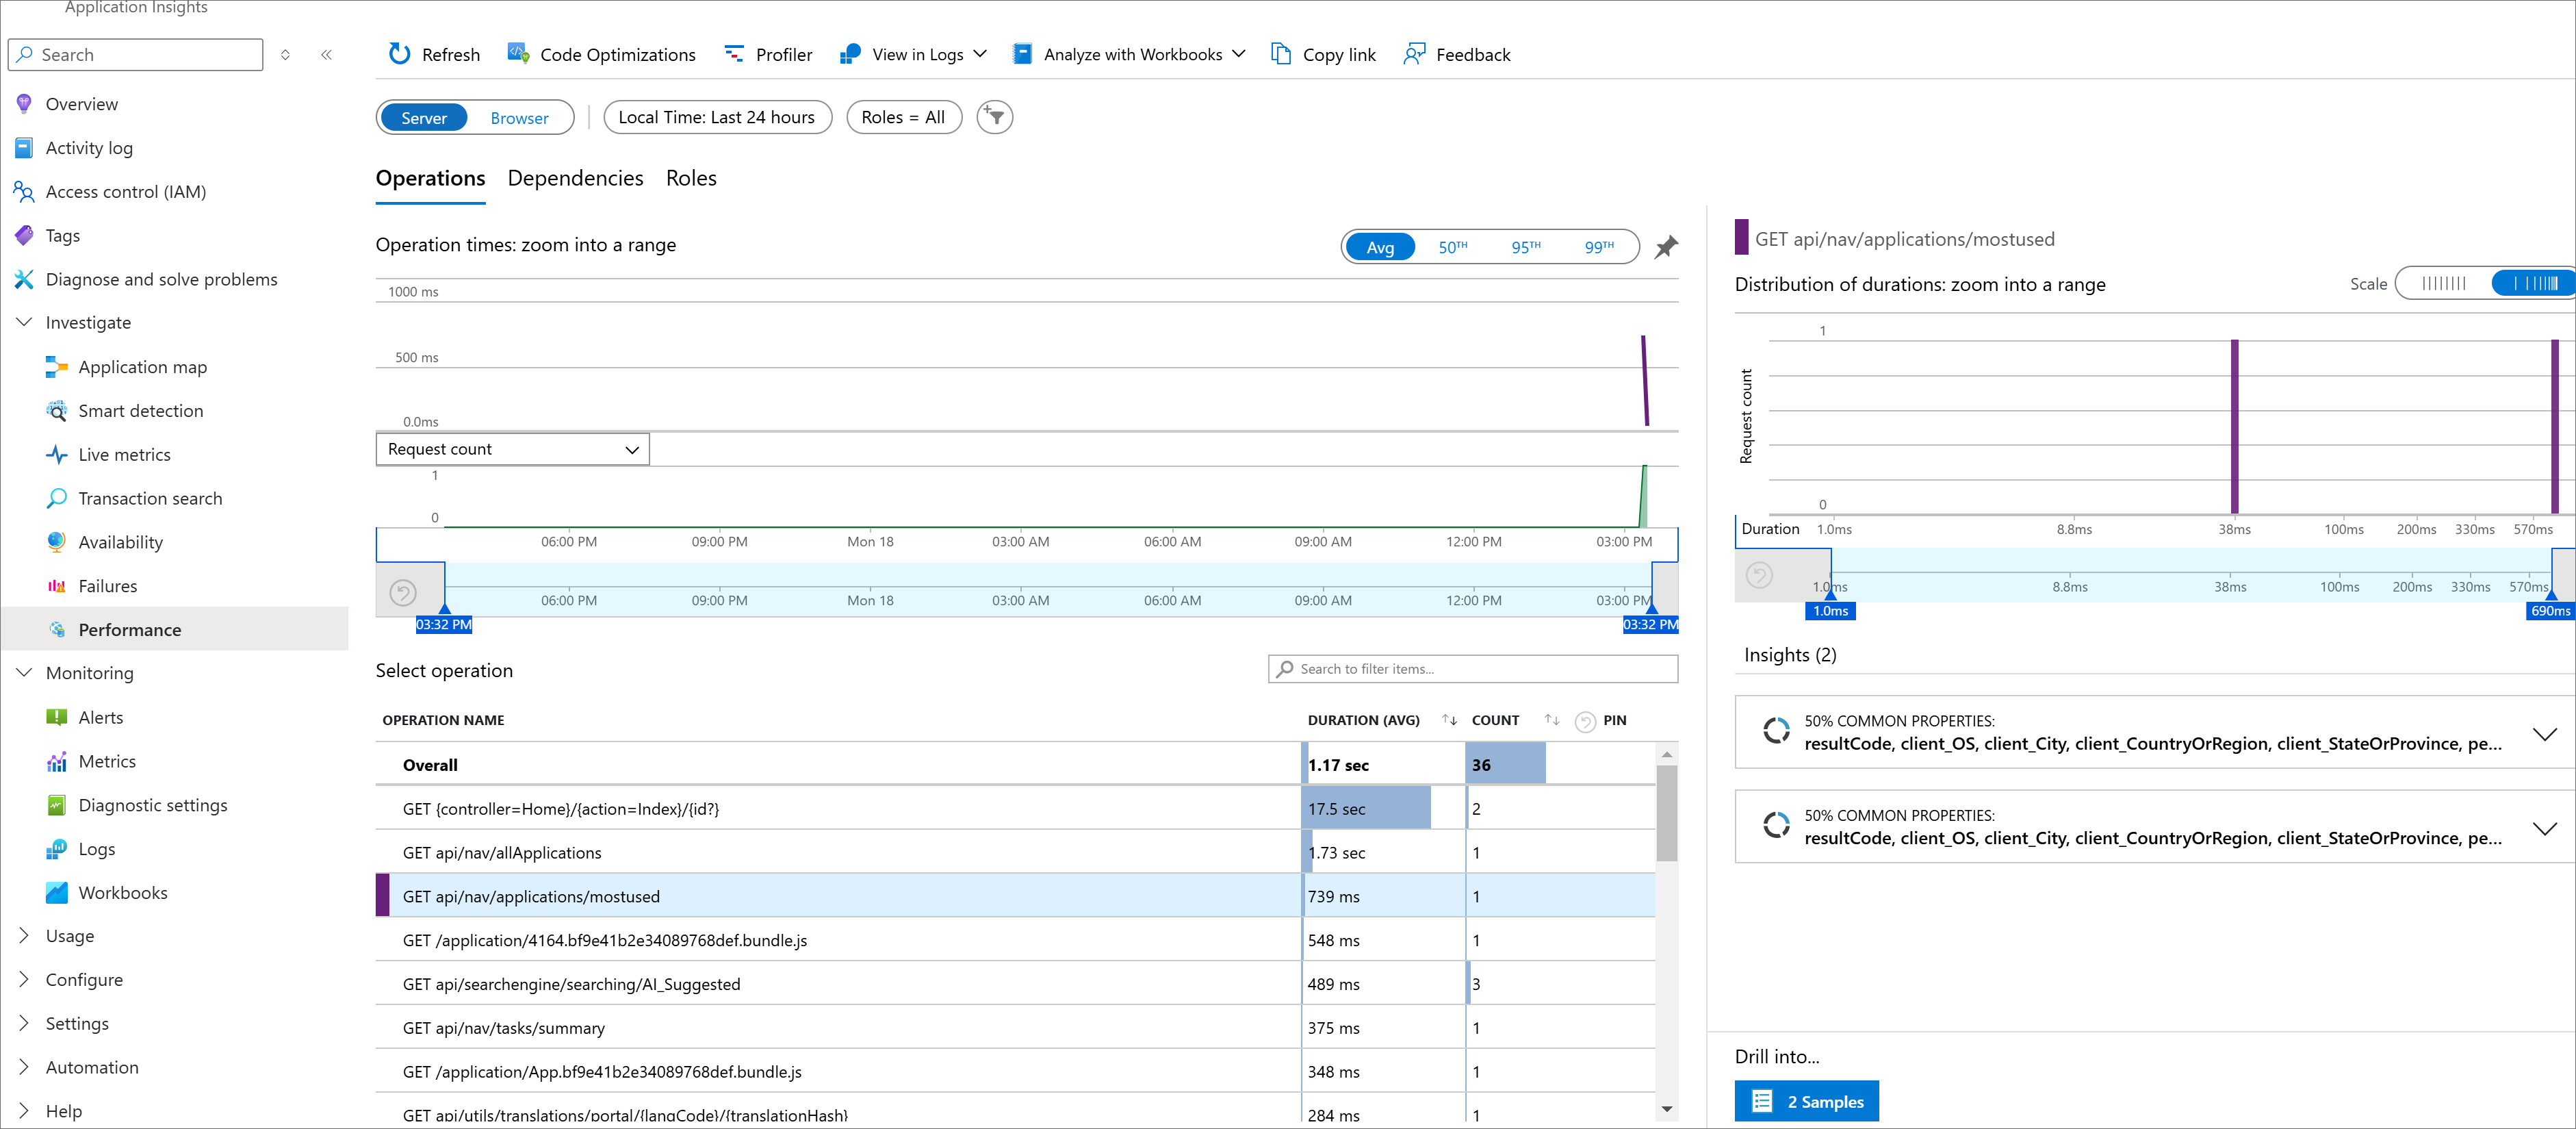
After saving the modifications, restart Portal and return to the Azure platform. Open the Microsoft Sentinel tool. Shortly, the tool should display the data received from the WEBCON BPS platform.
Summary
The integration of the WEBCON BPS platform with the Microsoft Sentinel tool enhances the platform's overall security and reduces the risk of potential threats. Thanks to this, the solution can be used not only by security experts, but also by WEBCON BPS platform administrators.

