Hello everyone,
I'm trying to create an article-based analysis. The evaluation should list how often an item is affected in a complaint.
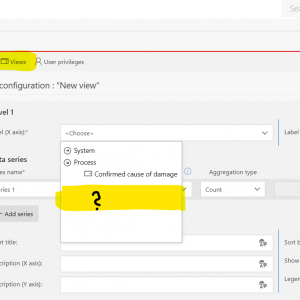
Unfortunately, although I can add the corresponding fields as columns for a list view, I cannot display them in the form of a chart.
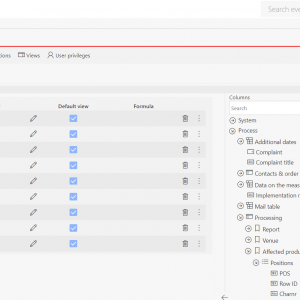
Why do these fields have the blue text [Positions] in front? What is it about these elements that I cannot select them in the view page as an element to be displayed (Image 2)?
Many thanks in advance.
Greetings,
Matthias
Reports and charts
Hi,
The word [Positions] applied in front of the columns represents the name of the item list. The three columns belong to the item list named Positions.
You cannot create a chart type report on the columns from the item list.
Thanks,
Raluca
Hi,
The word [Positions] applied in front of the columns represents the name of the item list. The three columns belong to the item list named Positions.
You cannot create a chart type report on the columns from the item list.
Thanks,
Raluca
Hi,
"You can add from the item list only details for each level of the chart.
Thanks,
Raluca
Hi everyone,
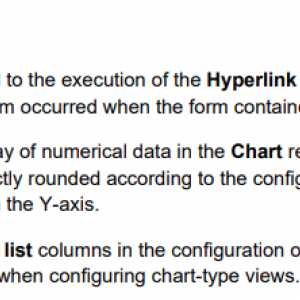
It seems like that was an error, and it's fixed in 2023.1.3.118 - screenshot from changelog in attachment.
Hi everyone,
It seems like that was an error, and it's fixed in 2023.1.3.118 - screenshot from changelog in attachment.
Great tip, thank you. I am currently using 2023.1.3.29 ,so this is definitley worth a try.
I just have to wait untill my it-department has time to update my Designer Studio.
Thank you!


