Hello all,
I'm trying to set up a report like the one in this article: https://community.webcon.com/posts/post/new-features-of-charts-in-reports/333/35
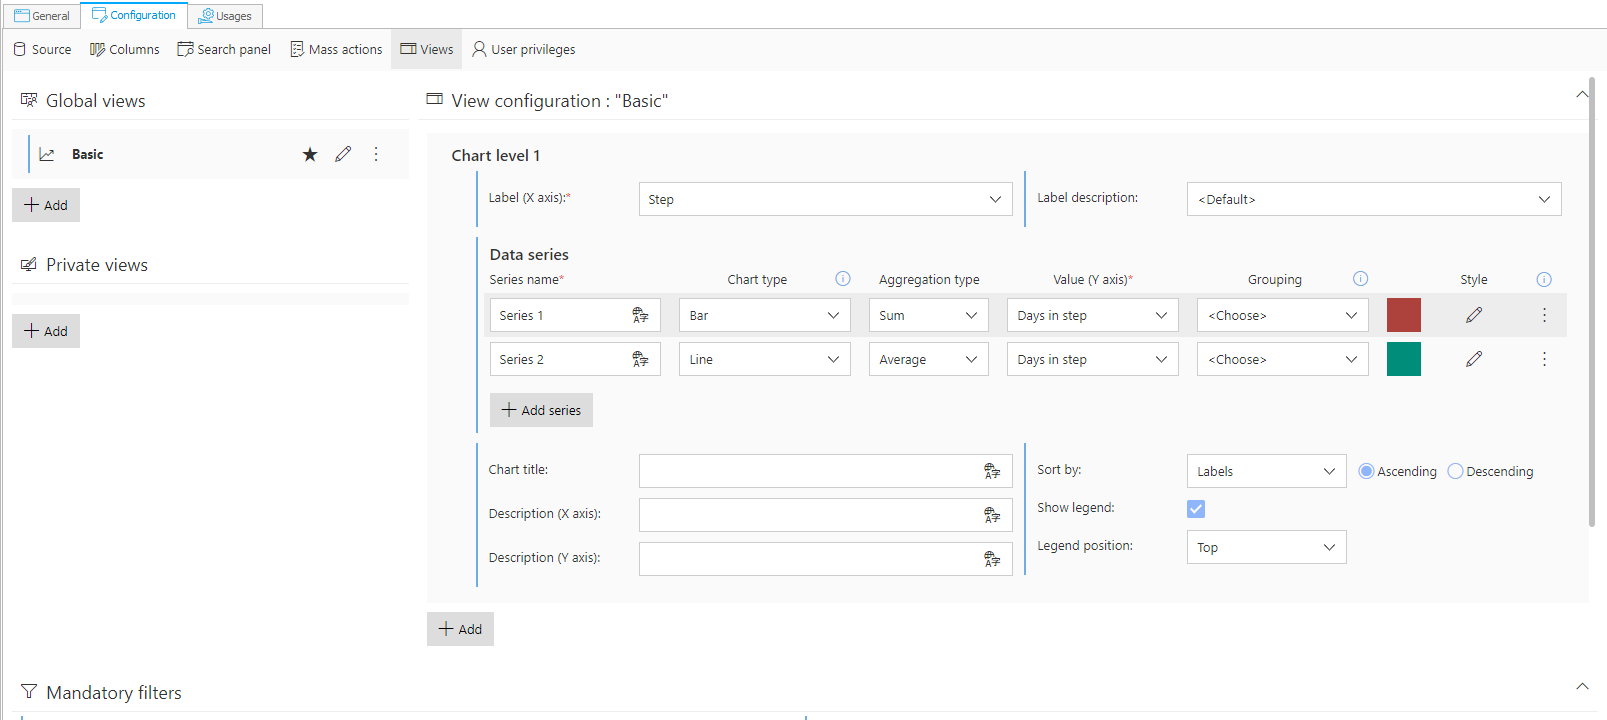
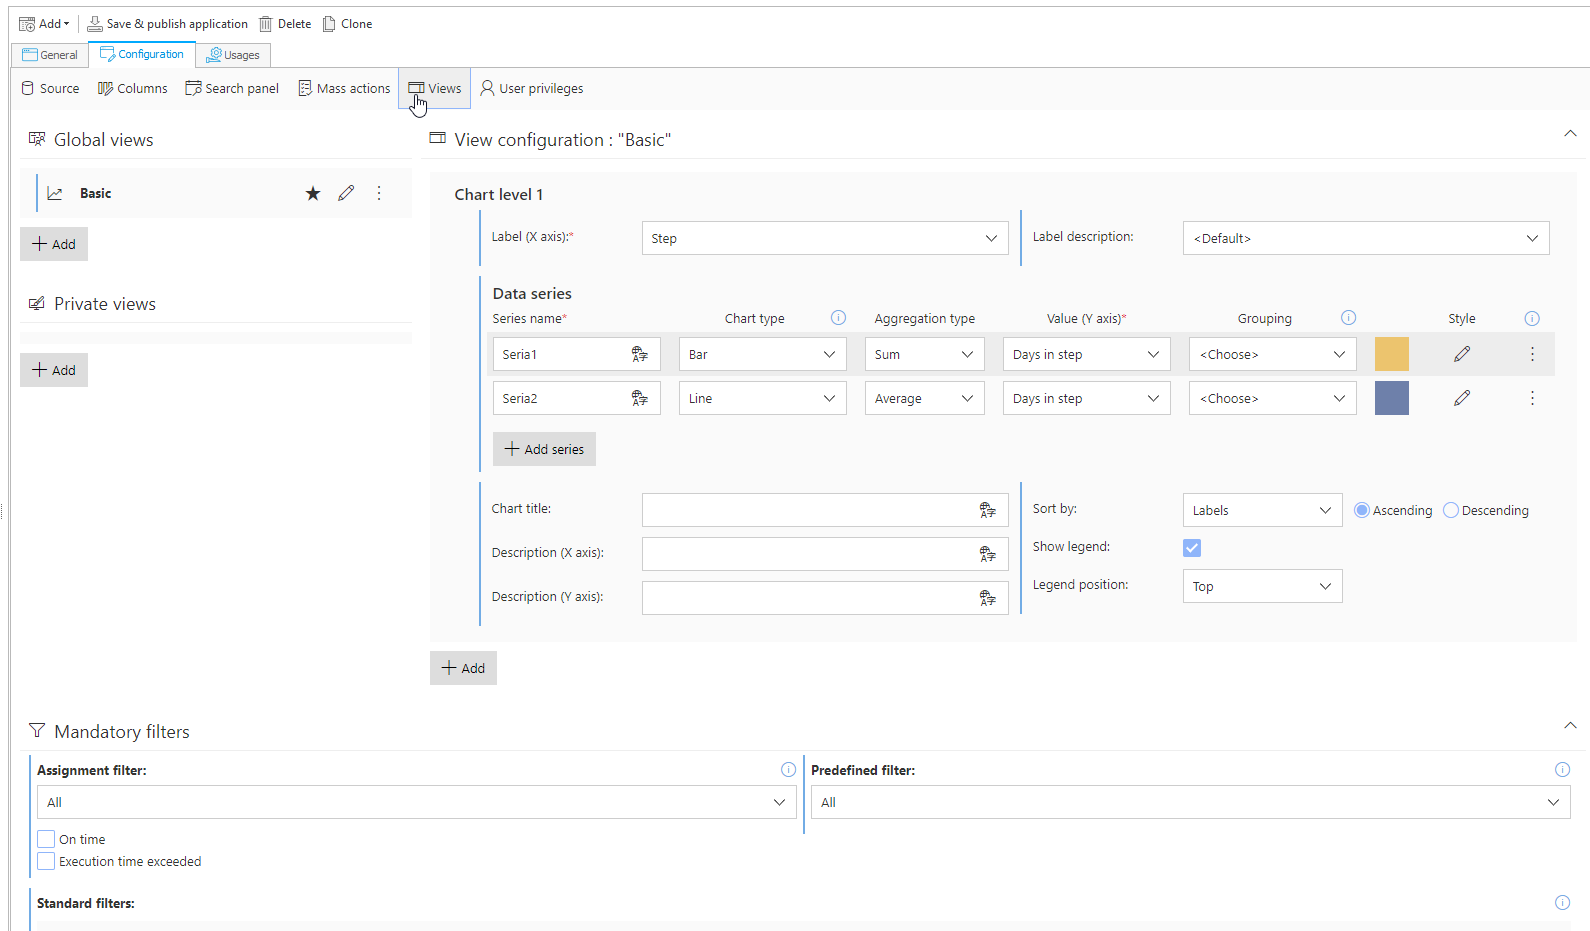
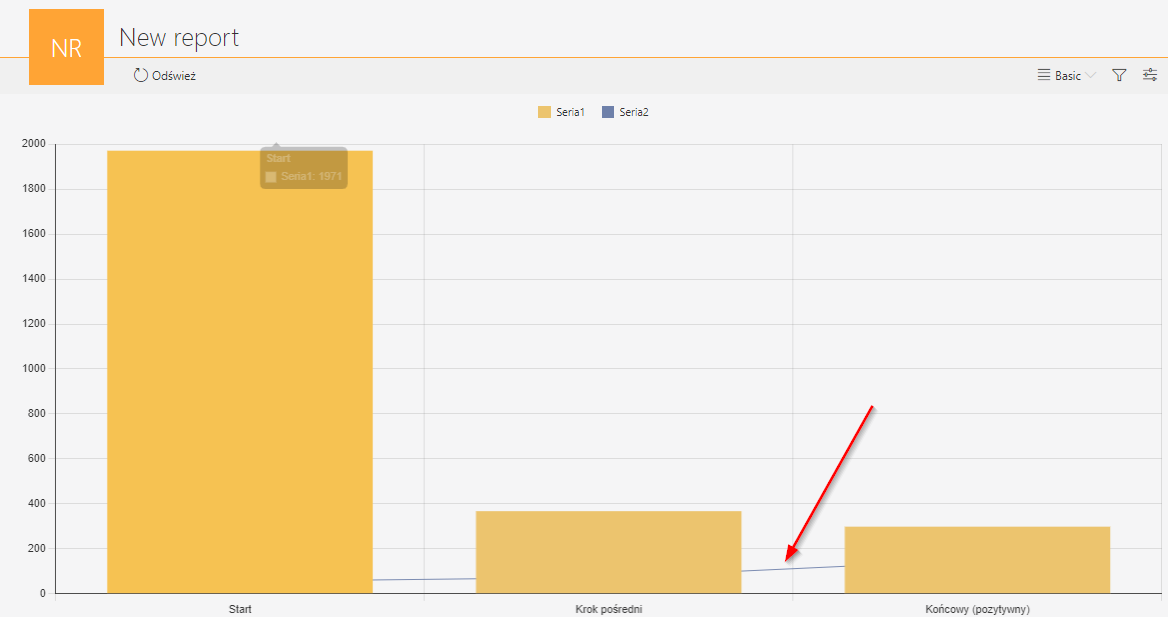
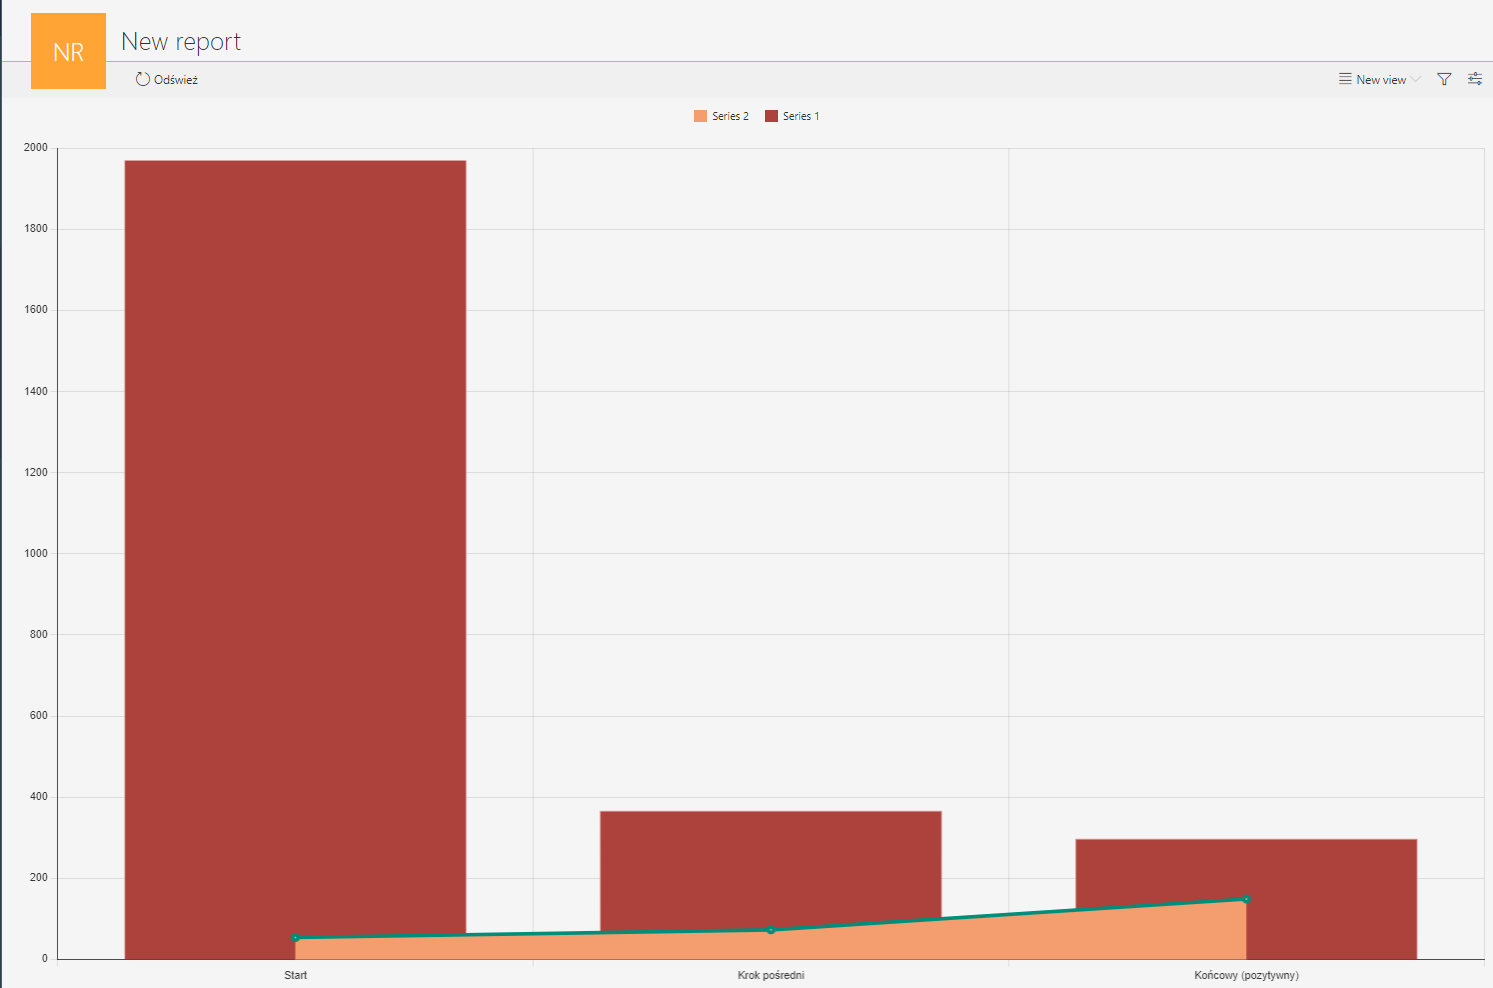
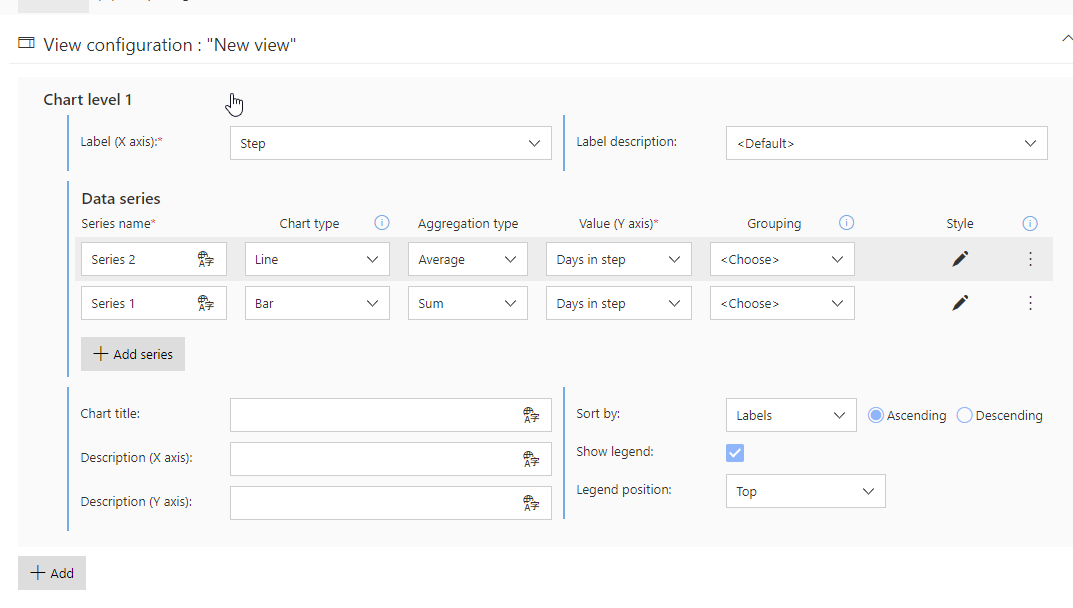
where I want to combine a Bar chart with a Line one but I keep having errors on the rendering of the report.
I want to show the sum of days in each step of the process (Bar chart) and the average Day(s) in step as a Line chart.
This is not working.
I don't have any filters, nor calculated columns. I've tried to create a chart with another field to check if the issue is related with Day(s) in step field, still I get the error.
Does anyone configured something like this?
Thank you