Filtering dashboard reports with the Filter widget
Applies to version: 2025 R1 and above; author: Łukasz Maciaszkiewicz
Introduction
Embedding reports within dashboards offers users convenient and quick access to the information they need. To further streamline working with such reports, the WEBCON BPS platform includes a feature that allows users to filter data directly from the dashboard level. This article explains and illustrates the functionality mentioned above using a selected business case.
Reports on dashboards
Adding a report to the dashboard involves embedding its widget and linking it to the data source associated with that dashboard. This functionality enables convenient management of data sources directly from the dashboard and allows multiple reports to draw data from even a single source. This solution also enables embedding Filter widgets, allowing users to quickly narrow down the data displayed in dashboard reports.
This article is dedicated to exploring this functionality and its potential applications.
NOTE: for detailed information on reports embedded within the dashboard, please refer to the article available on the Community website at the following address.
Business case
The company distributing refrigeration systems has a Sales Department consisting of several people. The employees of the Sales Department use every day the dedicated "Sales" application on the WEBCON BPS platform. This application allows them to register orders, oversee their execution, and manage relationships with both clients and suppliers. Since the department employees frequently use various reports in their daily tasks, it was decided to streamline their work by making all reports available in one place within the application: the dashboard.
Filtering with the Filter widget
Creating the "Information about orders" dashboard, which includes reports, turned out to be a great success. Employees now have all the data they need in one place and no longer have to switch between separate windows. So, why do the employees seem dissatisfied?
It's because of the filtering! To inspect order data for a specific client, users must narrow down two reports by the same value each time, i.e., the name of the ordering party or the order date. While it may seem like a minor inconvenience, there's constant complaining in the department, as nearly every employee has to repeat this task several times a day.
Information about the dissatisfaction in the Department reached the ears of the application designer. To resolve the issue, he decided to use a simple dashboard widget called Filter.
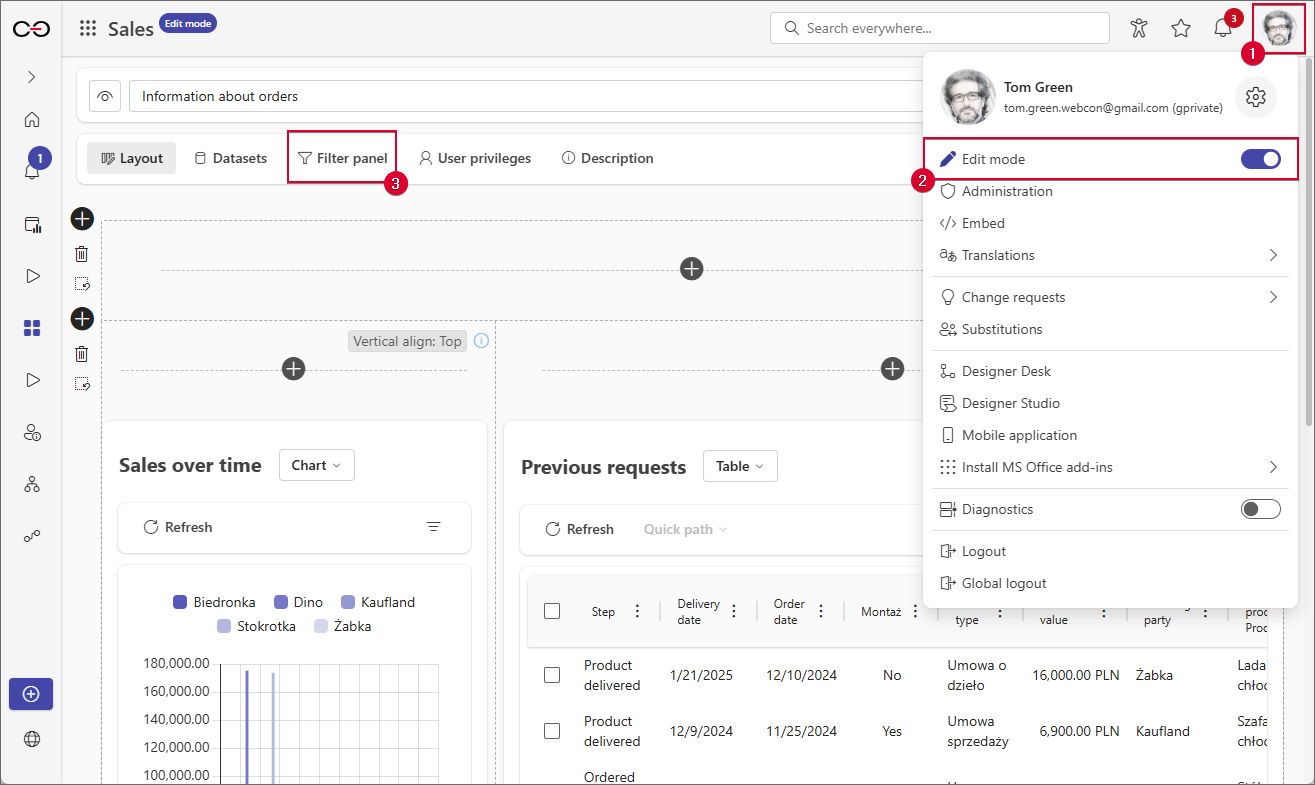
The Filter widget allows for the convenient simultaneous filtering of multiple reports embedded in the dashboard. Of course, simply adding a widget isn't enough, as it merely serves as a place to collect the filters defined by the designer. Therefore, it's best to start by defining the form fields whose values will be used to filter data across both reports. To do this, open the target dashboard (in this case, the "Information about orders" dashboard), switch to edit mode (User profile → Edit mode), and navigate to the Filter panel tab.
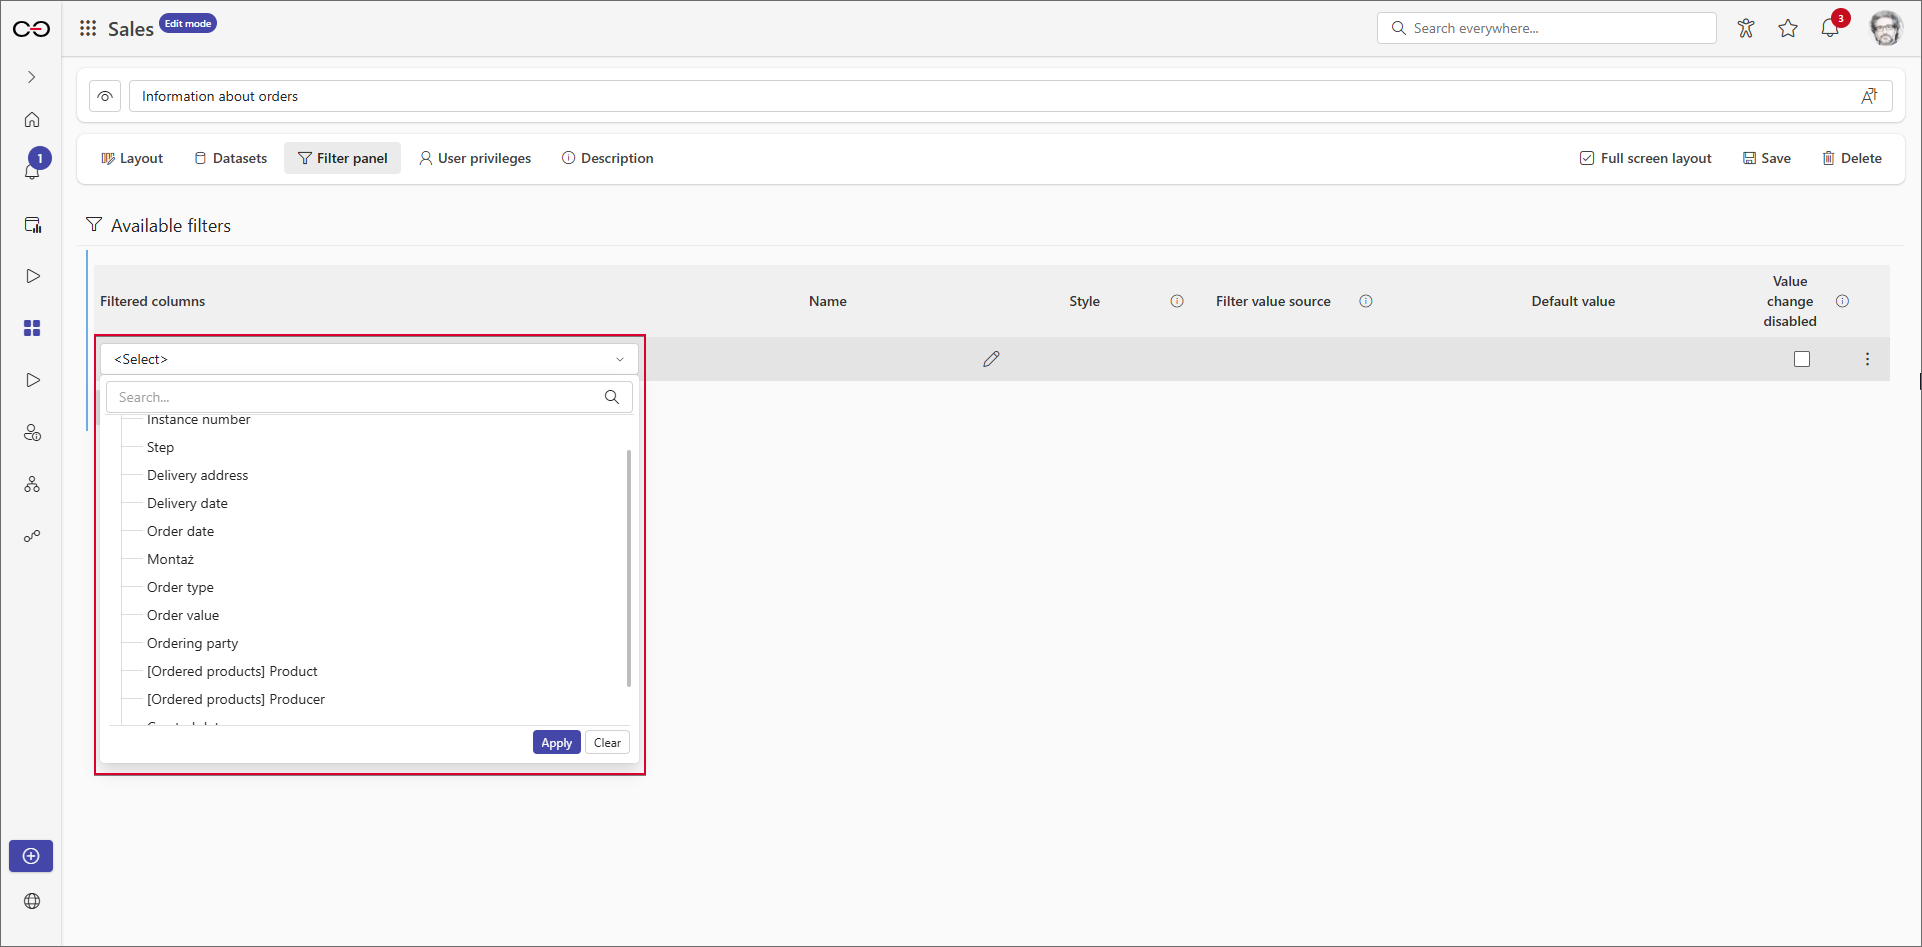
In the tab window, go to the Available filters section and click the Add button to define the form field whose values will be used to filter the reports. In the newly added row, open the drop-down list in the Filtered columns field.
Since both target reports—the "Sales over time" chart and the "Previous requests" table – use data from a shared data source ("Order data") assigned to the dashboard, expand the node for this data source and first select the "Ordering party" form field, confirming your selection by clicking the Apply button.
The remaining columns in the row allow you to specify various filter properties, but their additional configuration is not required. In this case, go to the Style column and select the Selection list option, which will allow users to select multiple values at once.
NOTE: leaving the Name field empty automatically assigns the name of the selected attribute to the configured filter.
After defining the first filter for the "Ordering party" form field, it's time to add the second filter for the "Order date" field. To do this, repeat the steps above by selecting "Order date" from the Filtered columns list. (Due to the different data type stored in this form field, there are slightly fewer configuration options available in this case.)
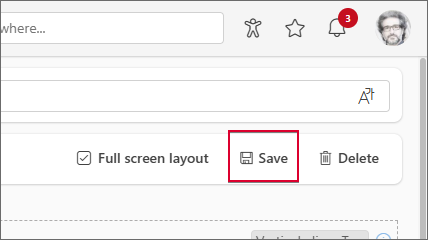
The new configuration must, of course, be saved by clicking the Save button in the upper-right corner of the window.
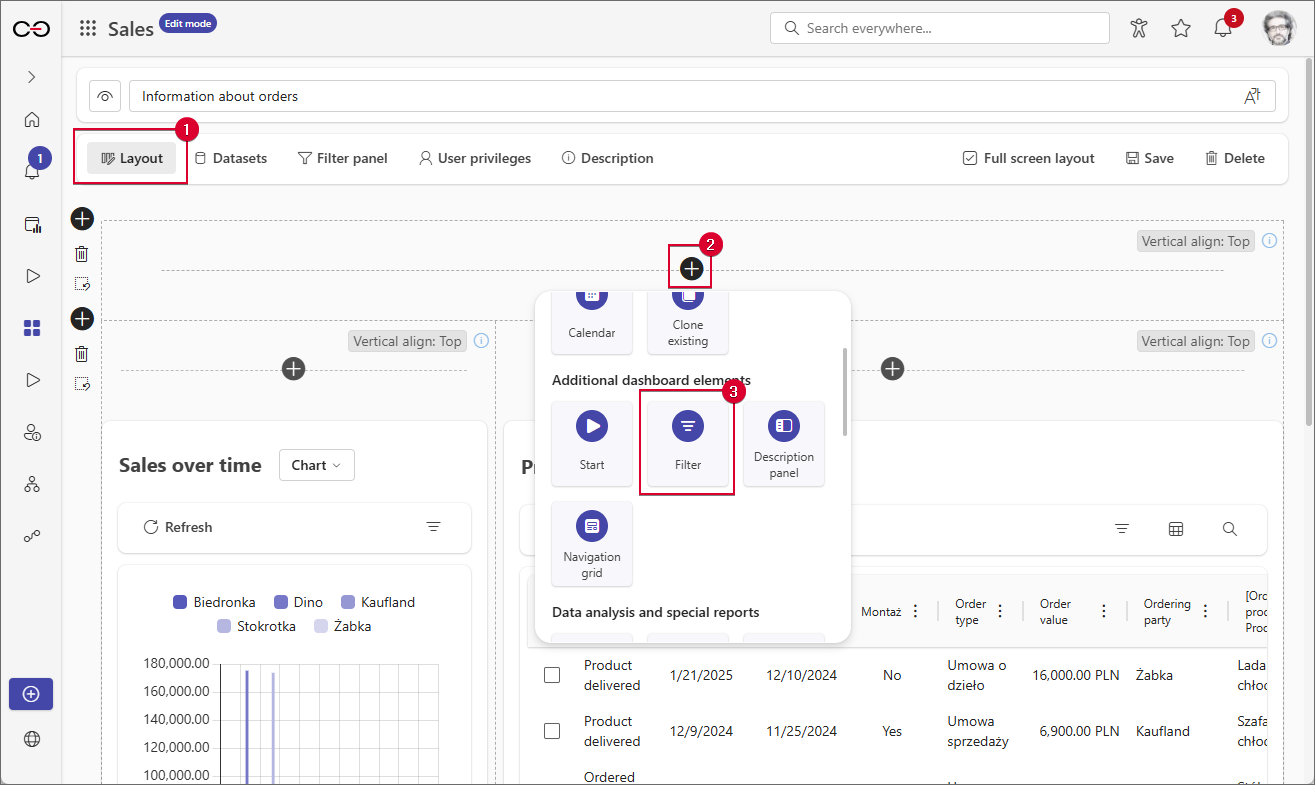
With both filters in place, you can finally embed the Filter widget. To do this, go to the Layout tab and click the plus button in the desired section of the dashboard. In the menu that appears, go to the Additional dashboard elements section and select Filter.
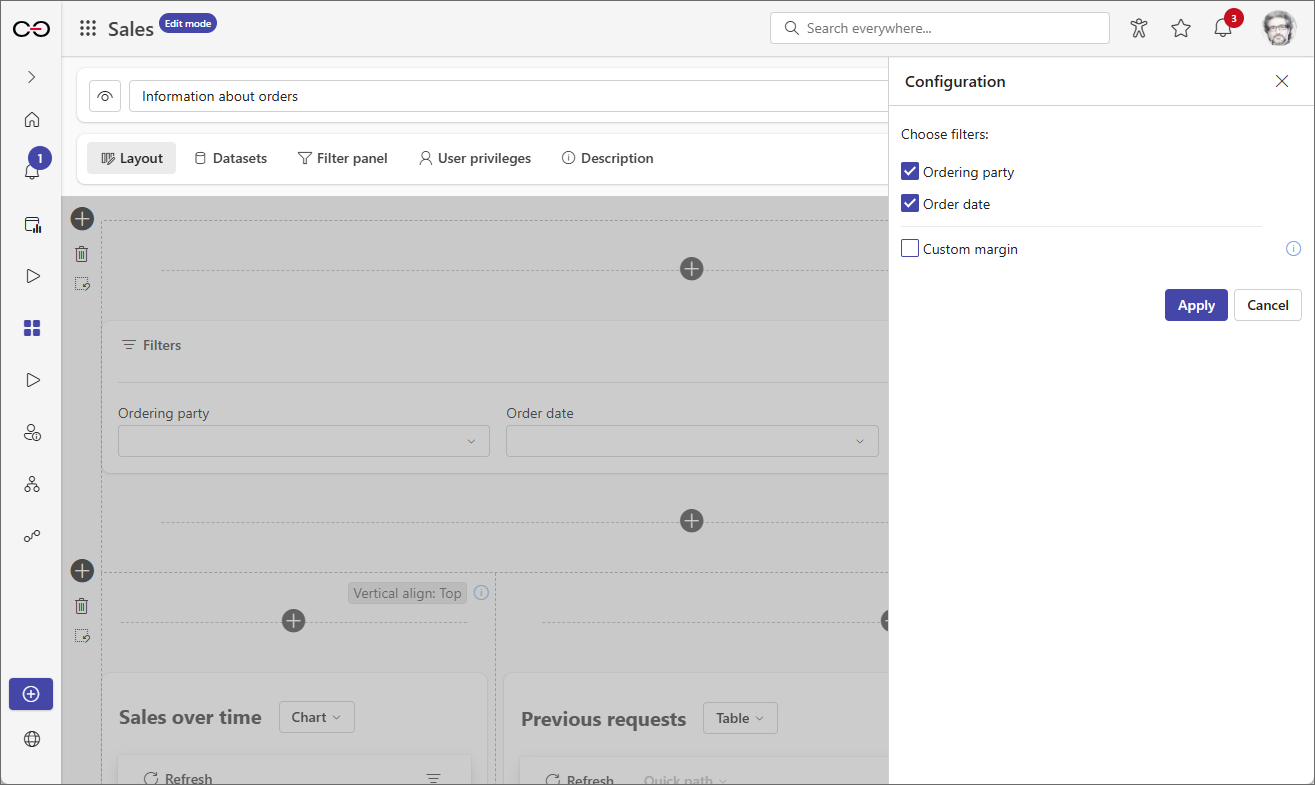
After selecting the widget, choose the "Ordering party" and "Order date" filters in the side panel on the right, and click the Apply button. As a result, two predefined filters will be added to the widget, and the widget itself will be embedded in the dashboard.
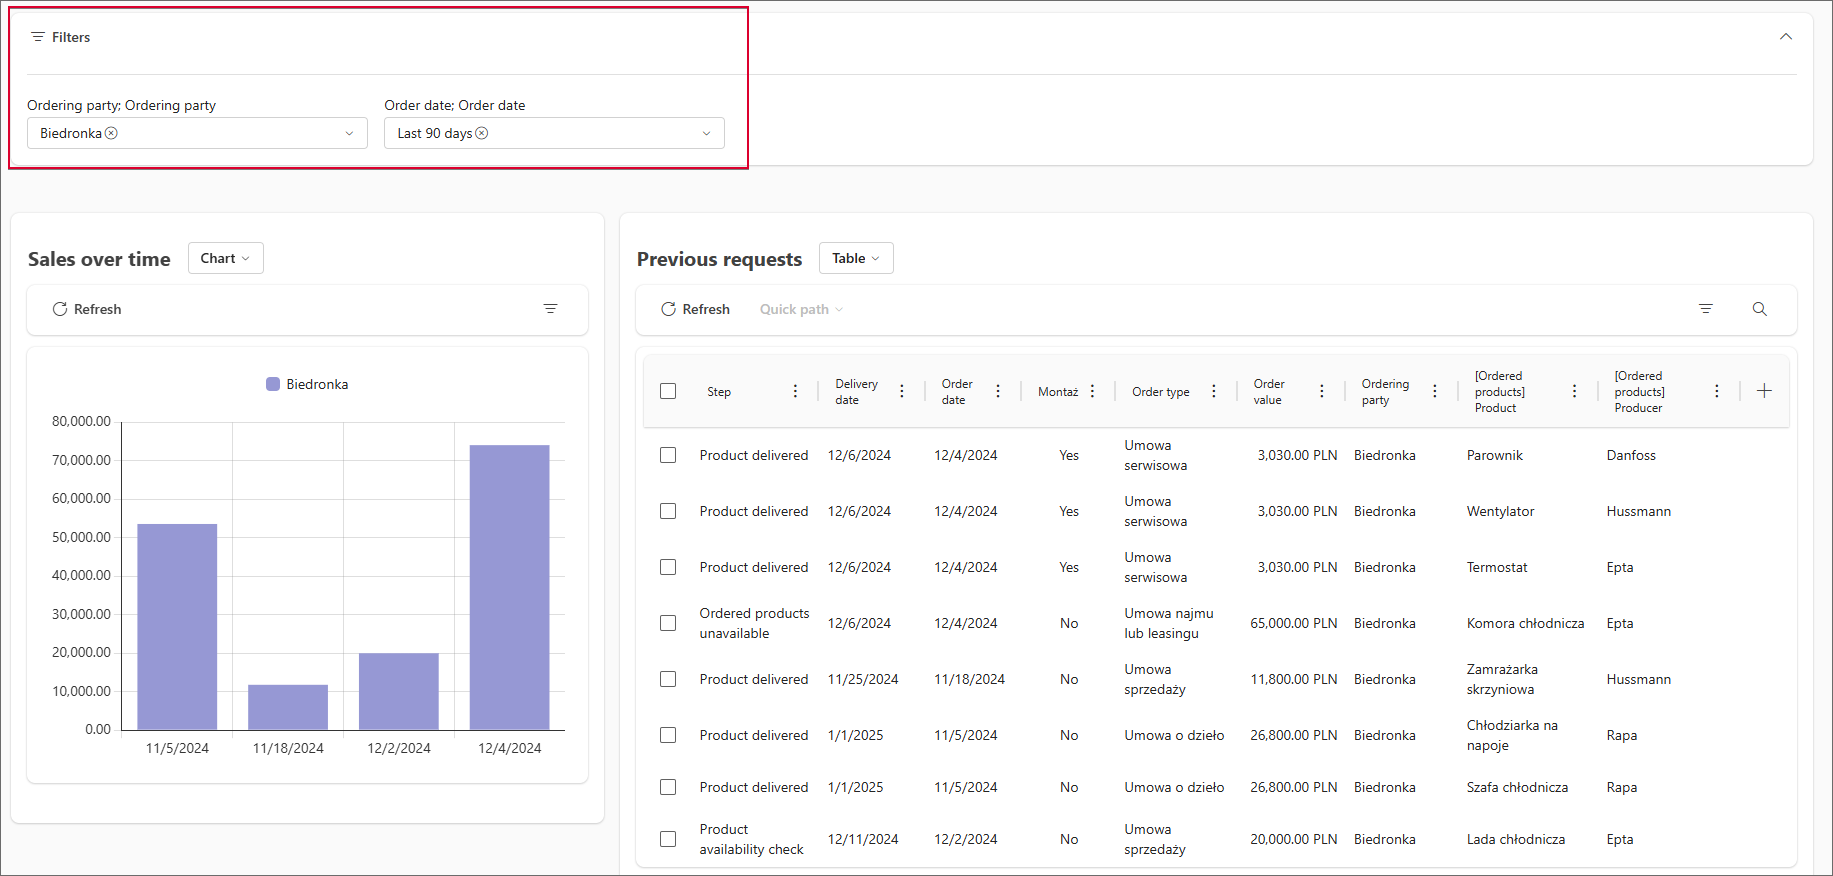
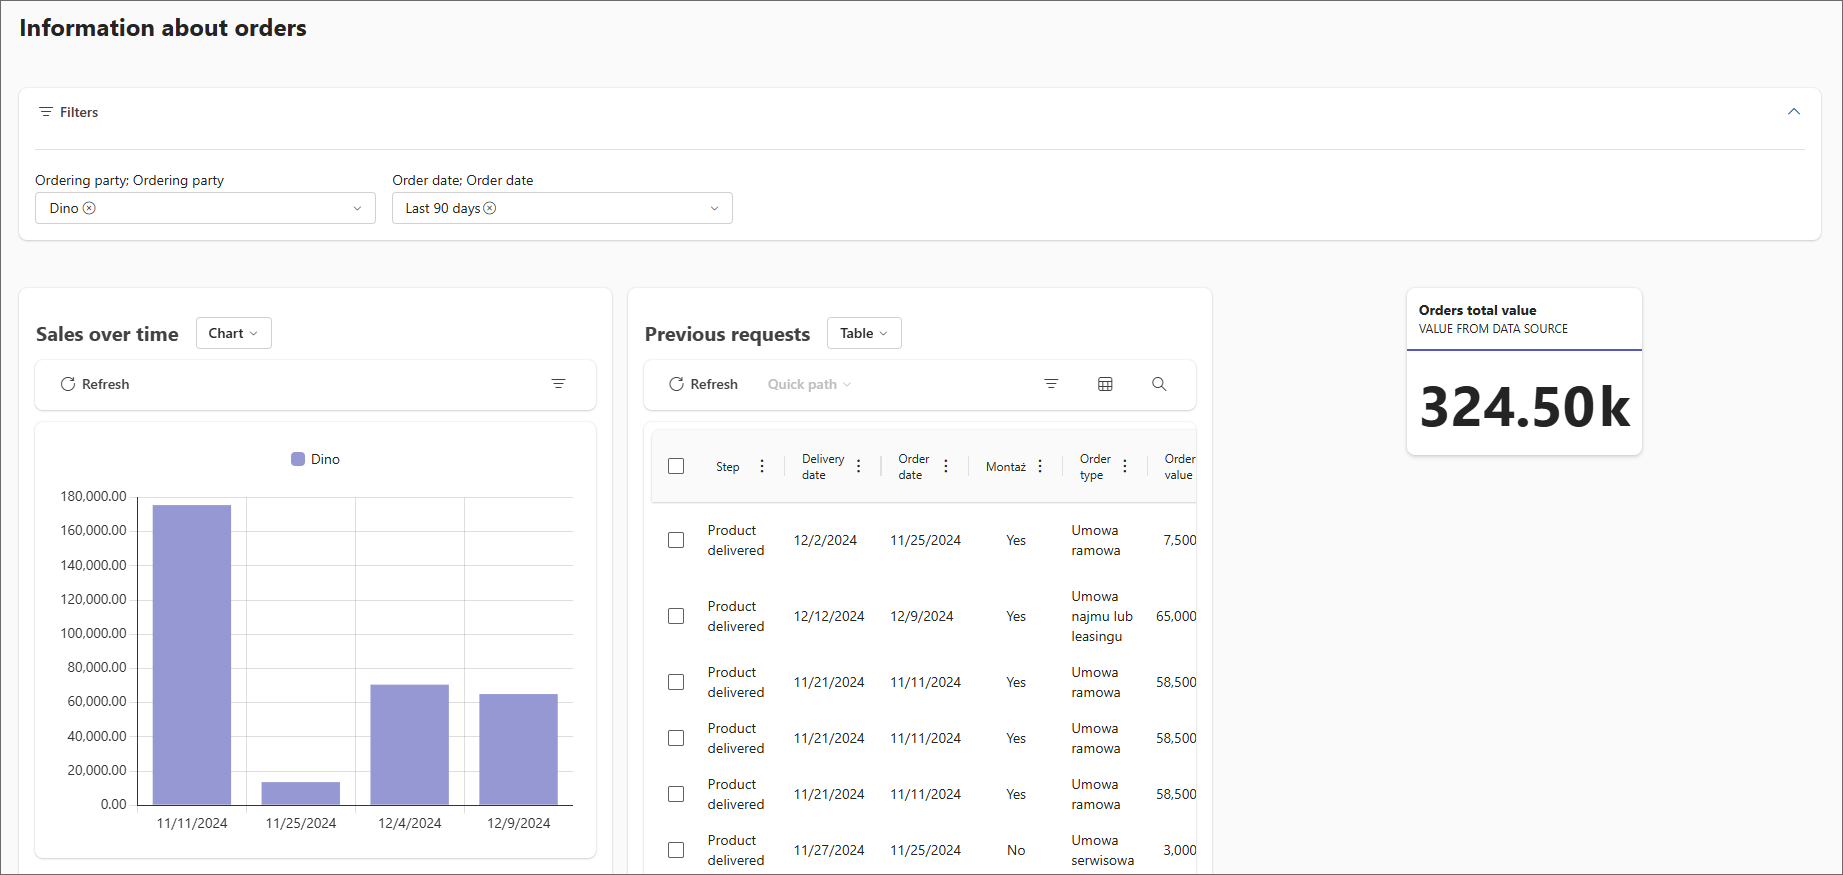
Save your changes and exit the edit mode – now it's time to test the new widget! To do this, go to the widget, select any client name from the "Ordering party" filter list, and then choose Last 90 Days from the "Order date" filter. As you can see, changing the value in one of the filters updates the data in both reports visible on the dashboard.
- Filtering reports without a common data source
Mission accomplished! Filtering is no longer a headache for the department's employees, and the designer can finally breathe a sigh of relief. Unfortunately, not for long... Just a week later, the head of the Sales Department, thrilled with the new functionality, asks the designer to add one more report in the form of a Report tile. The problem is that it needs to draw data from a separate data source, but at the same time, it must be filtered using the widget that applies to all existing reports (which draw data from a shared data source).
No worries – we’ve got this!
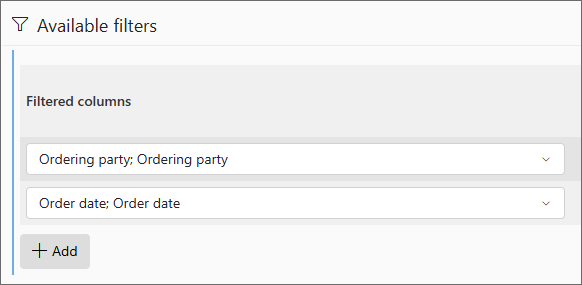
In the described case, the “Orders total value" Report tile was added to the dashboard, drawing data from a separate data source (different from the reports mentioned above). Despite drawing from different data sources, the reports contain columns that reference the same form fields, which can easily be filtered by configuring the appropriate filter. Therefore, enter edit mode and return to the Filter panel tab. The filters defined so far are as follows:

In the Filtered columns field, expand the list where the “Ordering party” form field is included. Currently, the list displays two data sources: the existing "Order data" and the new "Additional order data". Expand both nodes. First, ensure that the “Ordering party” form field is still selected in the first data source. Next, locate the form field with the same name in the second data source's node and select it as well. Note that the form fields must be of the same type. Confirm your selection by clicking the Apply button.
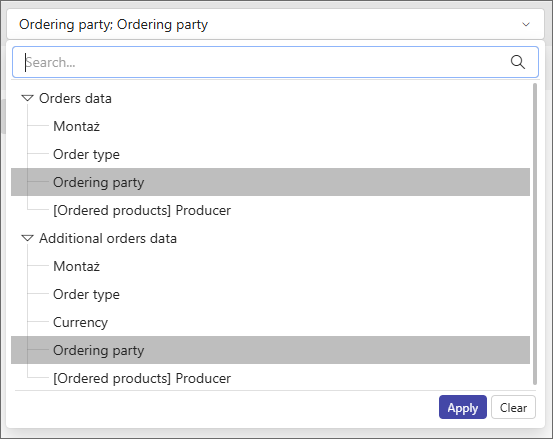
Repeat the same operation for the second row, but this time select the “Order date” form field for each data source. As a result, in both cases, the Filtered columns field will contain two selected values.
Save the changes, go to the Layout tab, and exit edit mode.
As you can see, despite the different data sources, all reports are simultaneously filtered when the appropriate value is selected in the Filter widget.
- Changing the source of filter values
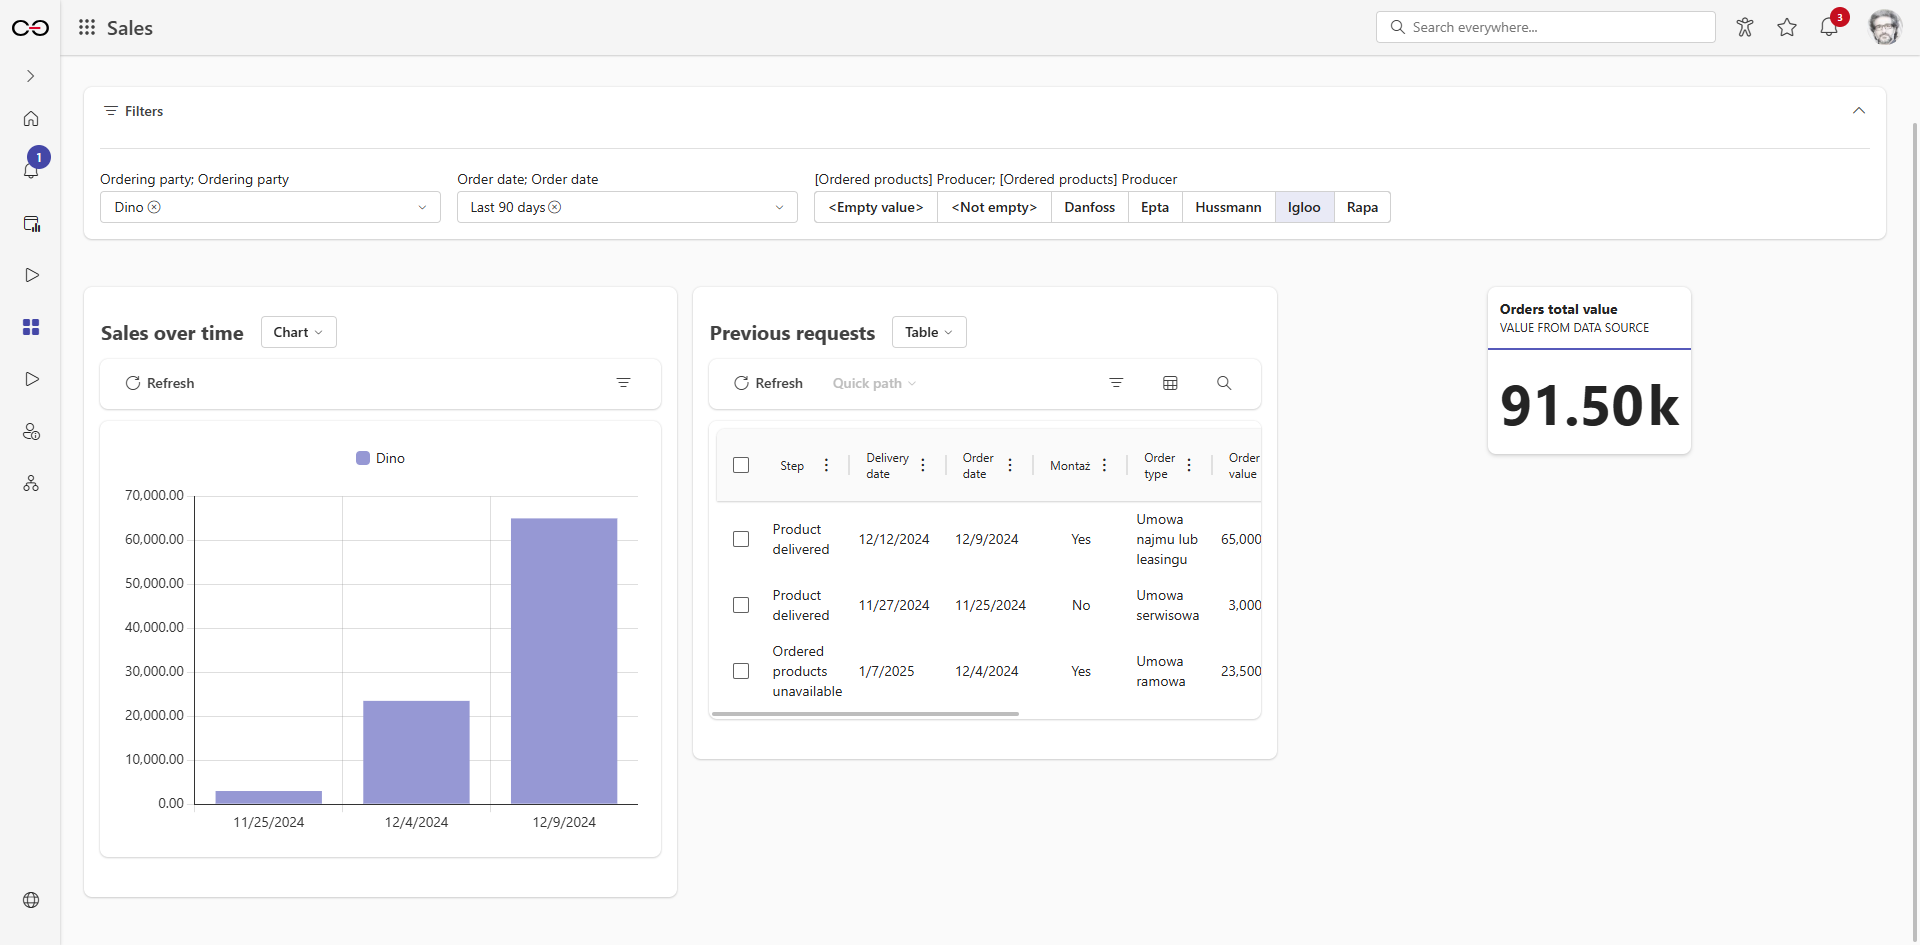
After some time, the widget embedded on the dashboard received an additional filter: “[Ordered products] Producer”. Thanks to this, employees in the Sales Department can track the popularity of specific brands among clients. However, the standard configuration of this filter means that applying it not only narrows the data in the report, but also limits the filter values available for selection. These values would be highly appreciated by the Sales Department employees, as they would make it easier to track client preferences and sales trends for specific brands. As it turns out, the designer of the WEBCON BPS application can easily implement such a solution…
Go to the Filter panel (but first, re-enable edit mode). Next, in the filter row where the "[Ordered products] Producer" form field is selected, check the Form field configuration data option in the Filter value source column. This option loads data directly from the source that feeds a specific form field (in this case, the "Producer" column in the Item list). Thanks to this, all values will always be available in the respective filter, regardless of the settings of the other filters.

After saving the changes and disabling the edit mode, you can observe a difference in the system operation. As you can see, despite setting the values of three filters, including the one in question, all values remain available. This allows department employees to immediately identify which brands are less favored by a given client.
Summary
The functionality of the Filter widget will be highly appreciated by all users of the WEBCON BPS application who work with large volumes of data and multiple reports on a daily basis. With its easy configuration and a wide range of useful options, filtering reports embedded on the dashboard is simple, and combining large amounts of information from various reports is seamless.

