OpenTelemetry in WEBCON 2026 R1
Applies to version: 2026 R1; author: Łukasz Maciaszkiewicz, Lily Adamowicz
Related documentation
A detailed description of the functionality regarding versions 2023 R1 to 2025:
Introduction
In the present-day dynamic and distributed application environments data monitoring and analysis are key to ensure high efficiency, reliability, and optimization of an application. To address those challenges, the 2023 R1 WEBCON BPS version has introduced support for OpenTelemetry – a powerful tool that streamlines collection of diagnostic data and metrics from IT systems.
This article discusses configuration of telemetry based on the OpenTelemetry standard in the WEBCON BPS system for its Portal and Service components.
What is telemetry?
Telemetry is a process of collecting, sending, and analyzing diagnostic and operation data from IT systems. In practical terms, this involves monitoring and collecting data from various components of an IT system in order to obtain information about their operation, performance, security, and many other important parameters.
Telemetry offers a number of advantages, such as monitoring and diagnosing problems in real time, performance optimization based on data analysis and bottlenecks identification, streamlined capacity planning and scalability. What is more, it enables remote system monitoring and management, and provides basis for taking informed decisions regarding IT infrastructure maintenance and optimization.
The OpenTelemetry project
OpenTelemetry is an open project aimed at standardizing and streamlining monitoring, analyzing and managing distributed systems. It is a tool that lets developers collect, generate, and send telemetric data (such as metrics, logs, and traces) from applications operating in various environments.
The solution integrates with a broad range of technologies and programming languages, thus allowing developers to collect diagnostic data from different sources, such as cloud services, servers, containers, and distributed applications. Its operation is based on the instrumentation principle, i.e. adding code to an application to collect telemetric data.
OpenTelemetry provides uniform API and libraries for a number of programming languages, which allows developers to use a uniform set of tools for monitoring applications in various environments.
- OpenTelemetry in WEBCON BPS
The WEBCON BPS system often acts a central point that integrates various IT systems employed in a company. Thanks to its OpenTelemetry support, system administrators obtain valuable insight into the whole traffic and flows handled by the system. As a result, it is not only possible to monitor the whole traffic, but you can also track all the accompanying actions and operations (including the ones associated with systems integrated with BPS). Apart from obvious advantages in terms of error diagnostics and identification, system administrators get access to important information on matters related to performance.
OpenTelemetry in WEBCON BPS – technical aspects
In technical terms, the support for OpenTelemetry in WEBCON BPS applies to its Portal and Service components. Two pillars of the aforementioned standard are made available, i.e. traces and metrics. Additionally, the Portal provides an option to export logs (Serilog) using the OTLP protocol; in the Service, exporting logs via OTLP is not supported.
Besides the OTLP protocol (OpenTelemetry Protocol), which forms a part of the OpenTelemetry project, it is possible to use the Jaeger platform for collecting and processing traces, and the Prometheus tool to receive and analyze metrics.
- The appsettings.json file
With the architectural changes in WEBCON, telemetry configuration is now handled entirely in the appsettings.json file (separately for the Portal and the Service). The otlpsettings.json file is no longer used.
OpenTelemetry settings are located under the "OpenTelemetry" section in appsettings.json:
"OpenTelemetry": {
  "Metrics": {
    "Enabled": false,
    "Prometheus": {
      "Enabled": true,
      "Endpoint": "/metrics",
      "CacheDuration": 100
    },
    "Exporters": {}
  },
  "Tracing": {
    "Enabled": false,
    "ShowExceptions": true,
    "HttpTracing": true,
    "SqlTracing": {
      "Enabled": true,
      "ShowDbStatements": true
    },
    "Exporters": {}
  },
  "Logs": {
    "Enabled": false,
    "Exporters": {}
  }
}
In metrics, the individual instrumentation enable/disable switches have been removed—once metrics are enabled, all available instrumentations are enabled.
Prometheus configuration is located in a separate section: OpenTelemetry:Metrics:Prometheus.
It is possible to export logs from Serilog via OTLP. Logs are exported according to the configuration in OpenTelemetry:Logs:Exporters. This feature is supported only in the Portal.
The structure of a single OTLP exporter under Exporters (Metrics/Tracing/Logs) is as follows:
"Otlp": {
  "Enabled": true,
  "Endpoint": "",
  "Headers": "",
  "Protocol": ""
}
Azure Monitor / Application Insights is supported, but it is configured in a separate section in appsettings.json (outside the OpenTelemetry section):
"ApplicationInsights": {
  "ConnectionString": "<connection string z Application Insights>"
}
Setting only ApplicationInsights:ConnectionString causes telemetry (traces, metrics, and logs) to be sent to Application Insights regardless of the Enabled switches in the OpenTelemetry section.
All settings under OpenTelemetry apply to both the Portal and the Service, except for logs (OpenTelemetry:Logs), which are supported only in the Portal.
- Supported instrumentation
As mentioned, WEBCON BPS supports two OpenTelemetry pillars, i.e. Tracing and Metrics. This also involves support for a number of modules that can be used in the configuration. The tables below contain information on supported instrumentation for both aforementioned pillars.
|
Tracing |
|
|
Module’s name |
Remarks |
|
ASP .NET Core Instrumentation |
|
|
SqlClient |
For Portal and Service it is possible to view SQL queries. |
|
HttpClient |
|
|
WCF Client |
Integration with Service |
* For traces WEBCON BPS supports data export by the OTLP protocol (configuration according to data recipient’s settings). For integration with Jaeger (OTLP/HTTP), set the endpoint to http://localhost:4318/v1/traces and set Protocol to http.
|
Metrics |
|
|
Module’s name |
Remarks |
|
ProcessInstrumentation |
|
|
RuntimeInstrumentation |
Configuration in the “ProcessInstrumentation” field |
|
AspNetCoreInstrumentation |
Configuration in the “WebInstrumentation” field |
|
HttpClientInstrumentation |
Configuration in the “WebInstrumentation” field |
* Metrics data export is possible through the OTLP protocol (configuration according to the data recipient’s settings) and the Prometheus platform (default endpoint setting: „/metrics”).
** Exporting logs (Serilog) is possible in the Portal via OTLP (configured under OpenTelemetry:Logs:Exporters).
*** It is not possible to enable each instrumentation separately—instrumentations are enabled automatically when metrics are turned on.
Configuration
To configure the OpenTelemetry standard, first set up data collector (a component responsible for collecting, processing, and sending telemetric data). In the discussed example, the Honeycomb tool is used to that end. The tool is available at: https://ui.eu1.honeycomb.io/ and will be used to collect traces.
Click the link provided above to enter the tool’s login page. Log in or if you have not created the account yet, click the Sign up for free today button [it is also possible to log in using your Google account (the Login with Google button)].
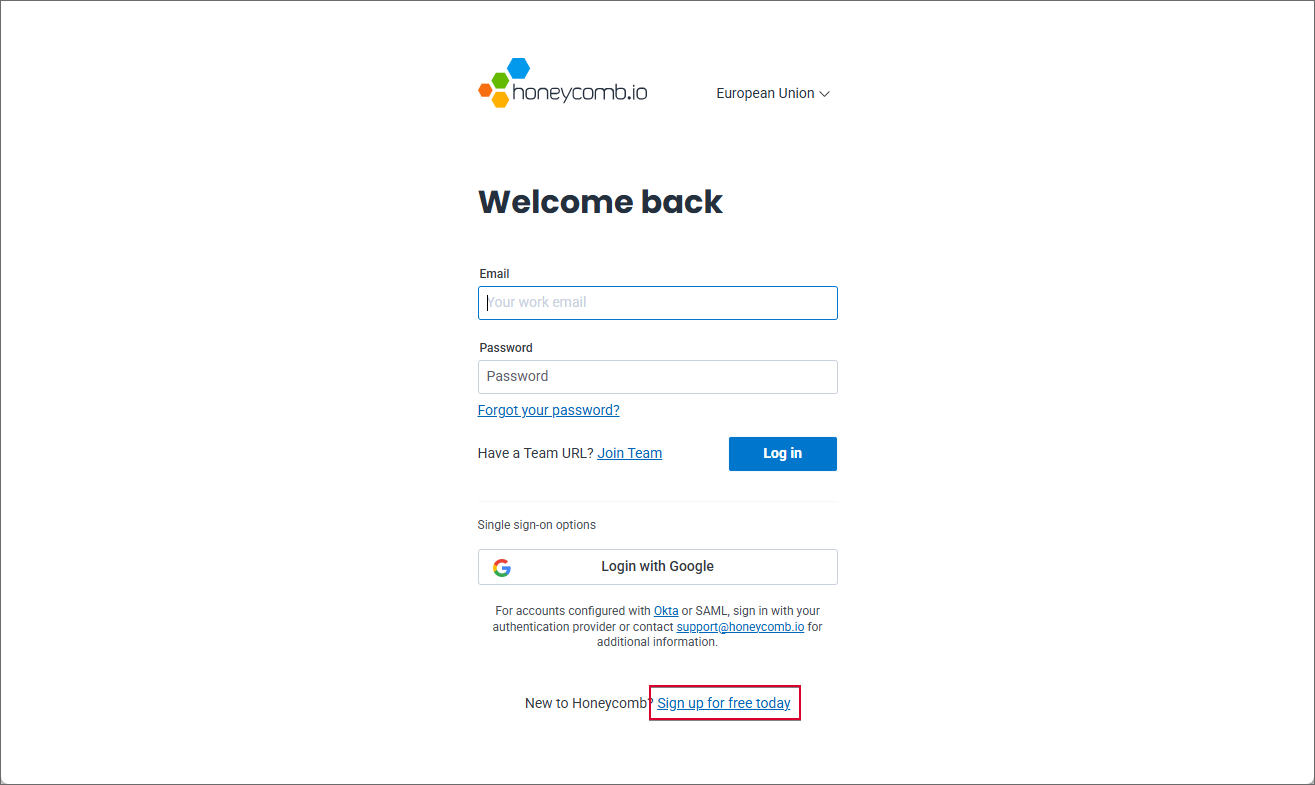
To create account, click the Sign up for free today
NOTE: the tool allows users to select one of the two available regions: European Union or North America. Since each region is assigned a different endpoint address (EU: https://api.eu1.honeycomb.io/v1/traces, North America: https://api.honeycomb.io/v1/traces), this will impact the configuration of the appsettings.json file addressed later in this article. The configuration described below applies to the European Union region.
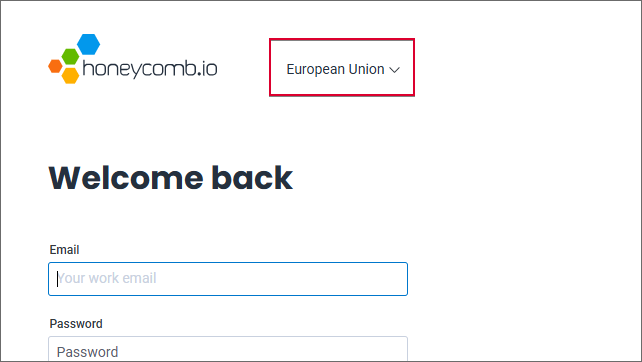
The button used for selecting region in the Honeycomb service
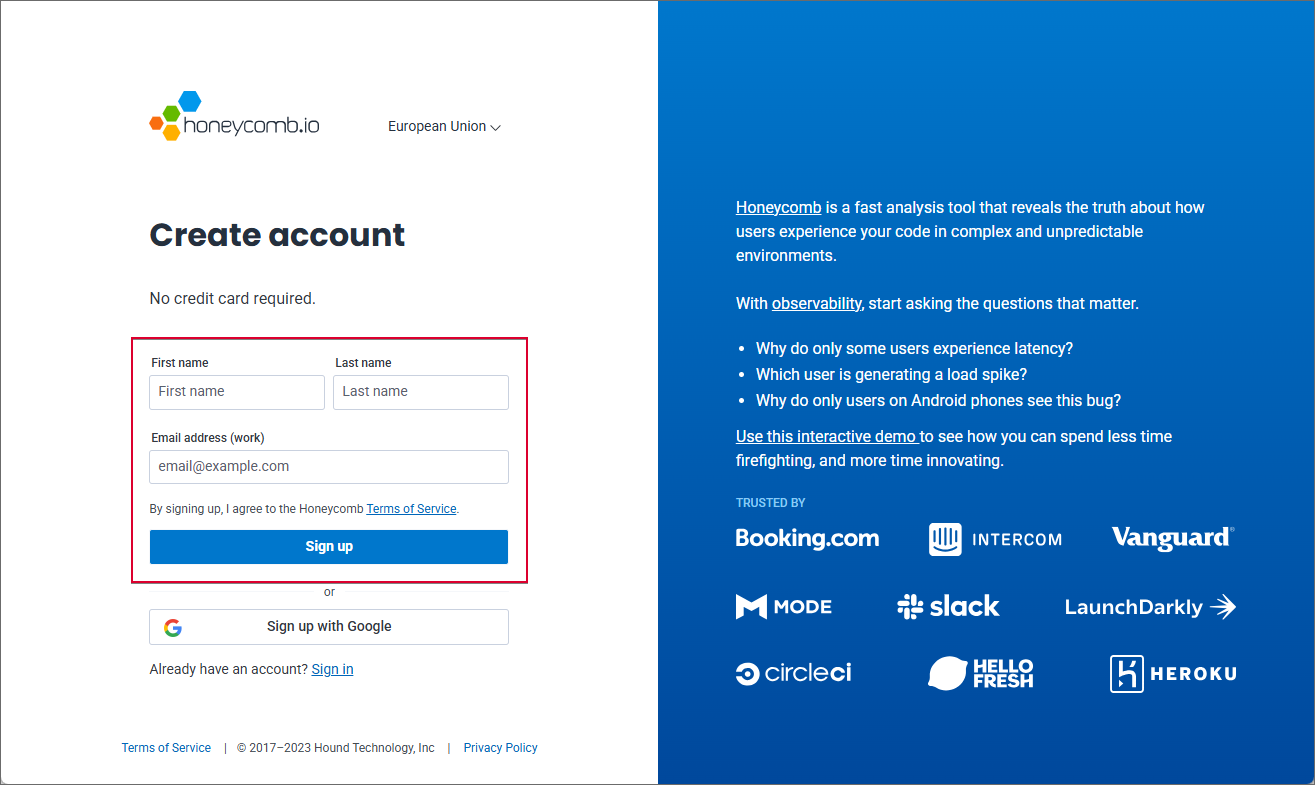
After clicking the Sign up for free today button, enter your first name, last name, and email address on the next page, then click Sign up.
Once you enter the aforementioned information and click the button, a message containing account activation link is delivered to your mailbox. Click it.
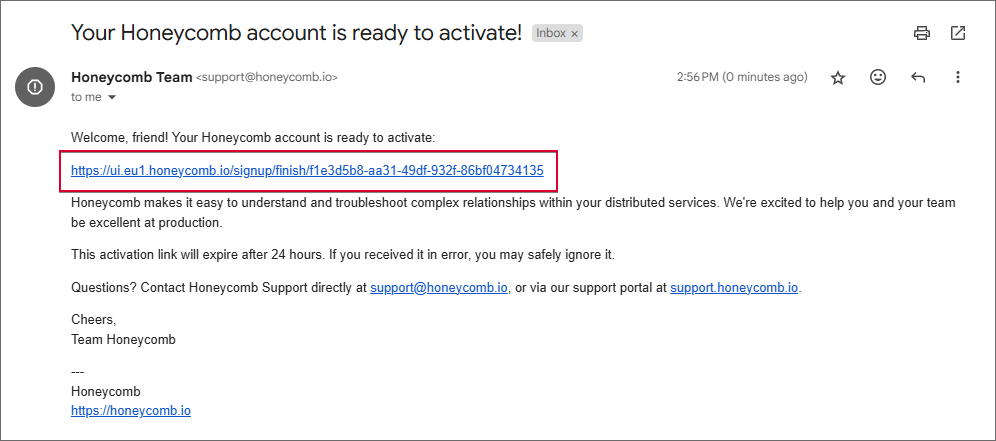
The email message containing account activation link for the Honeycomb service
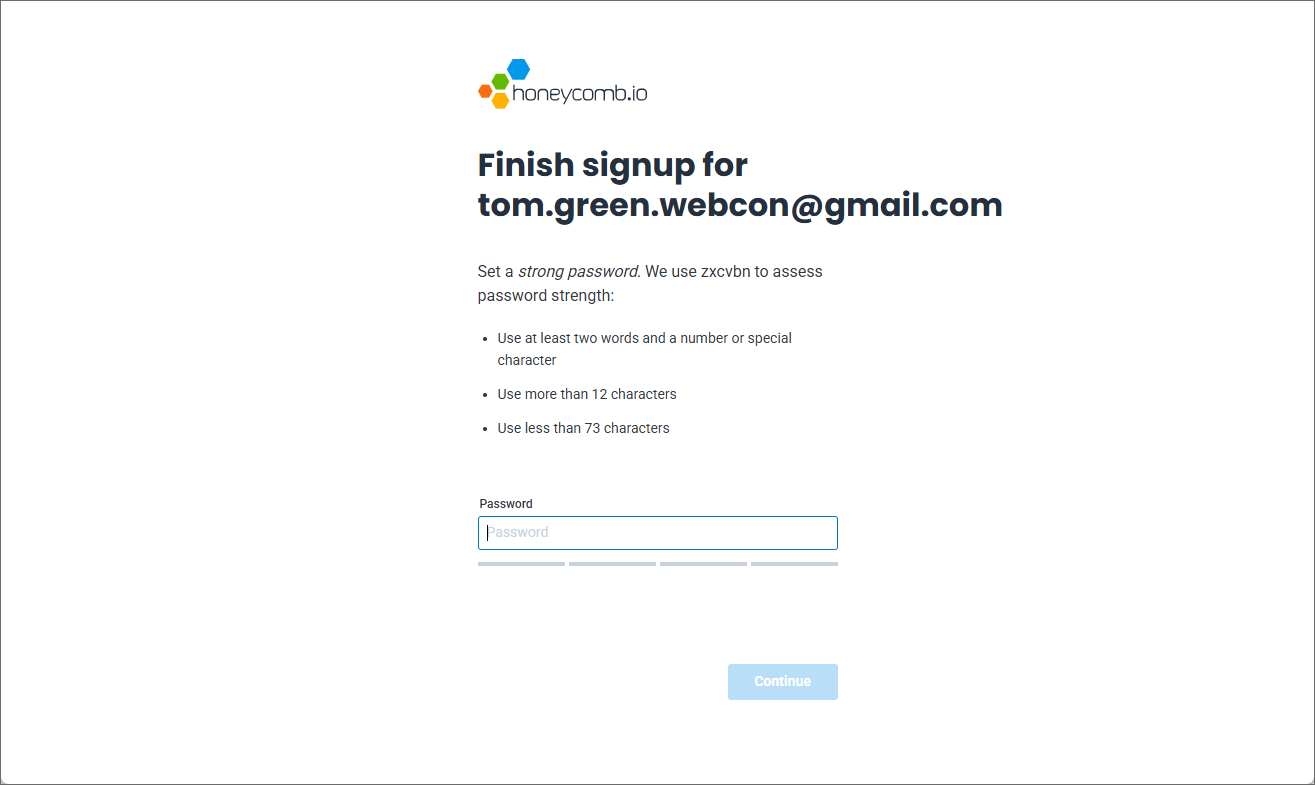
Clicking the link opens page where you can define your account password. (The password must have 12–72 characters, contain at least two words, and a number or a special character.)
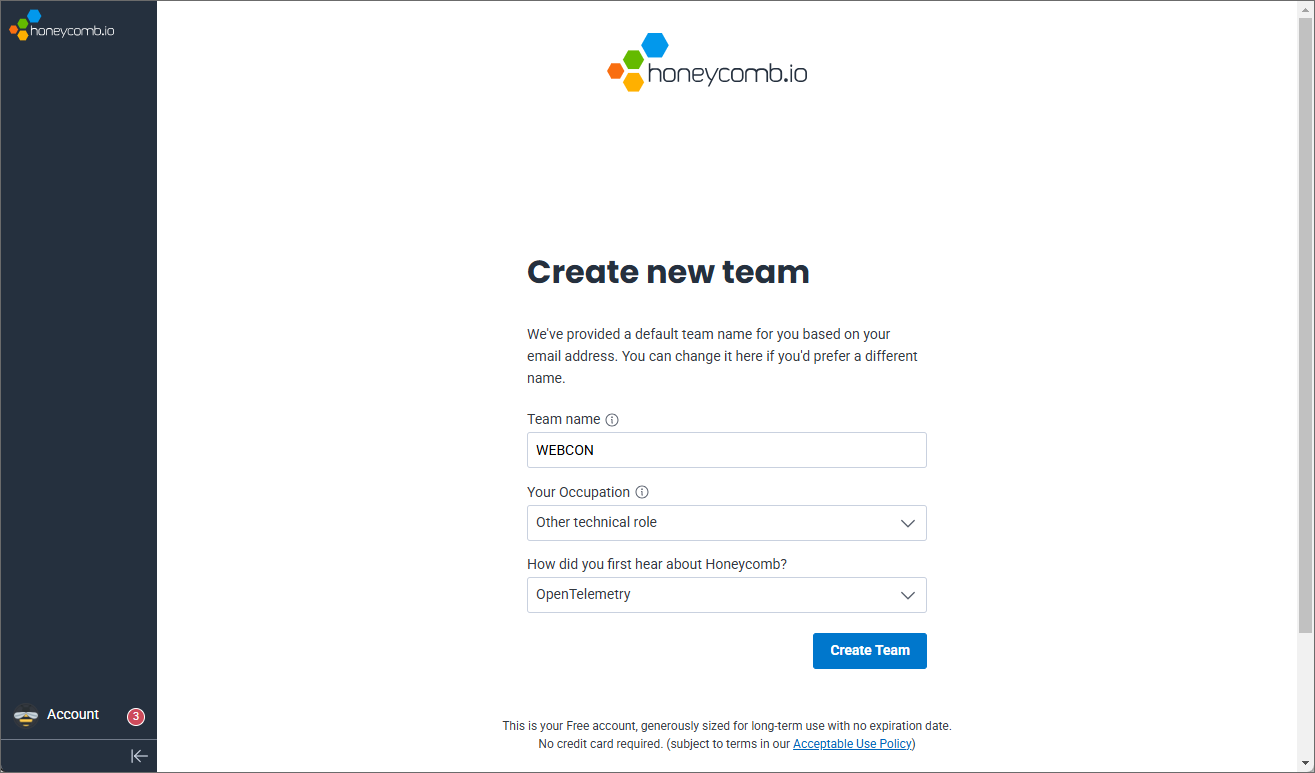
After entering the password and clicking Continue, proceed to create your team. The Team name field is automatically populated based on the provided email address. Users must specify their occupation (Your occupation), but answering the How did you first hear about Honeycomb? question is optional. Once you have entered the required information, click Create Team.
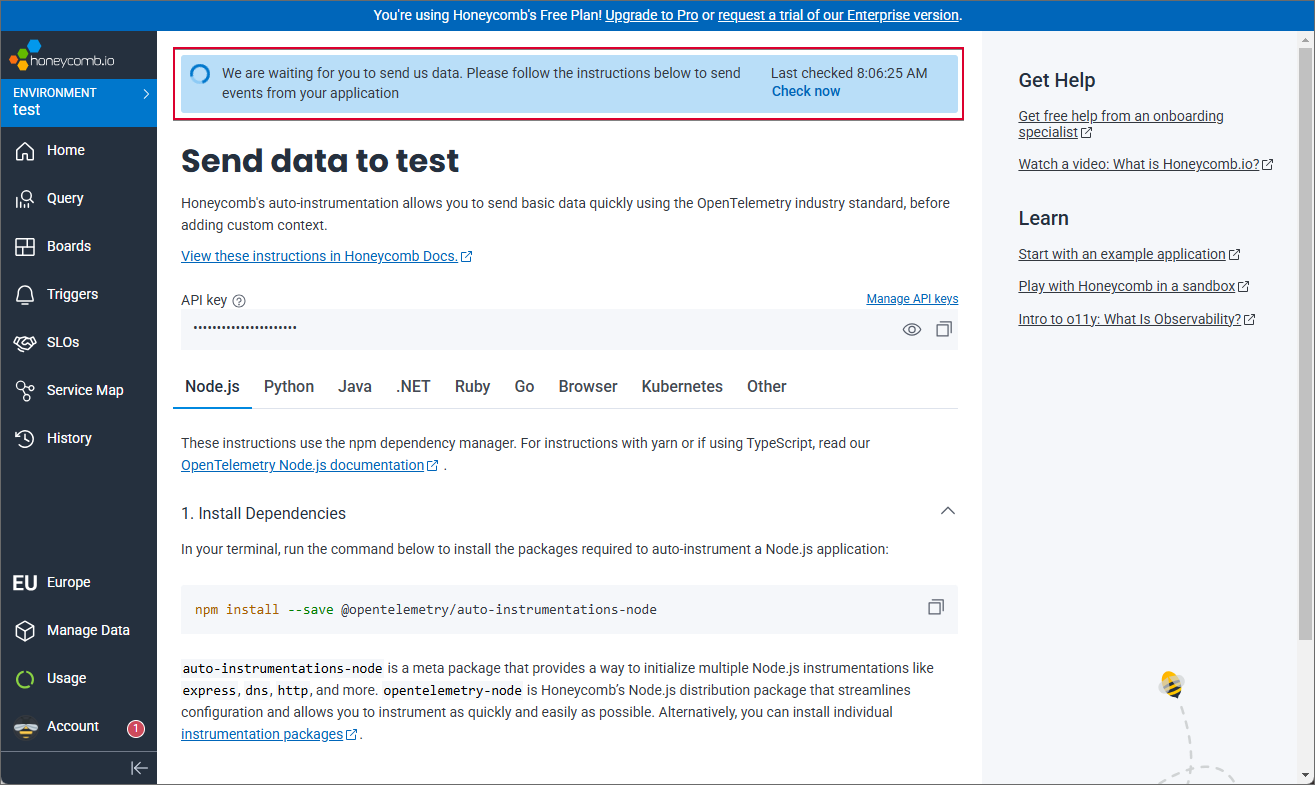
When the team is created, you are redirected to the tool’s main page. The upper part of its window displays a message informing that the system is waiting for data.
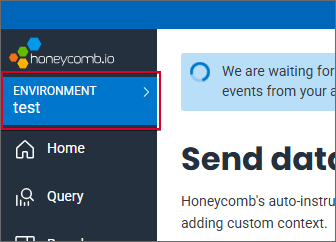
NOTE: once the account is created, you can use the default test environment to collect data. However, please note that it is also possible to create your own environment by clicking ENVIRONMENT → Manage environments → Create environment. This article describes the configuration on the “test” environment.
To utilize the newly created account, open the appsettings.json file located in both the Portal and Service main directories. (To edit the file you can use the Notepad software available in the Windows system or any source code editor, e.g. Notepad++). Given that the configuration of the aforementioned file is identical for Portal and Service, this article presents only the configuration of the Portal file, but remember to repeat the described steps for the Service file.
In the appsettings.json file, locate the OpenTelemetry nod and go to the Tracing section. Under the Exporters subsection, add a new exporter named HoneyComb by pasting the following lines:
"HoneyComb": {

   "Enabled": true,

   "Endpoint": "https://api.eu1.honeycomb.io/v1/traces",

   "Headers": "x-honeycomb-team=[your-api-key]",

   "Protocol": "http"

}
Next, replace the [your-api-key] text (provided in the Headers section) with the API key. You can find the key on the Honeycomb’s main page.
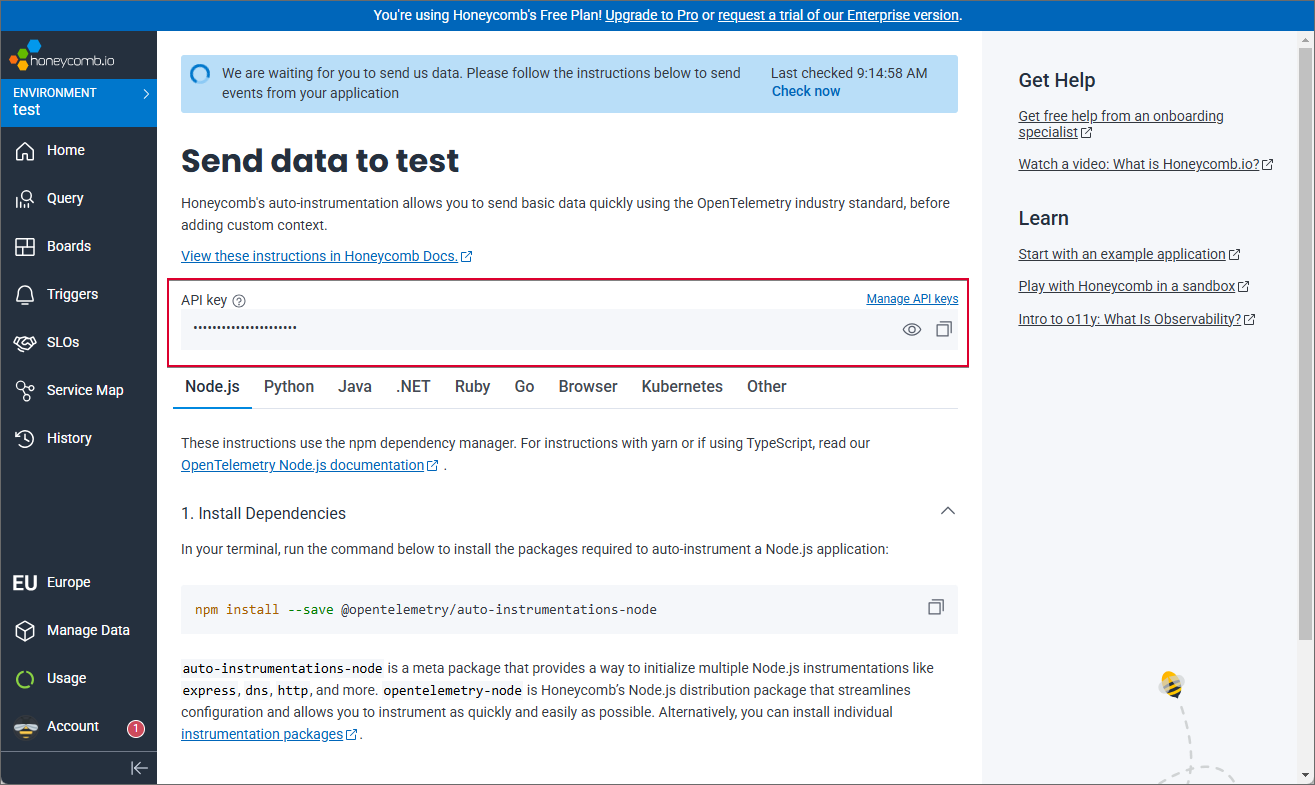
API key provided on the Honeycomb’s main page
Now, remember to set the Enabled parameter to the “true” value in both the Honeycomb node and its parent node (i.e. Tracing).
Save your changes and restart IIS (Internet Information Services).
The Honeycomb service should start receiving data from the WEBCON BPS platform shortly (you can expedite the process by performing several operations in Portal).
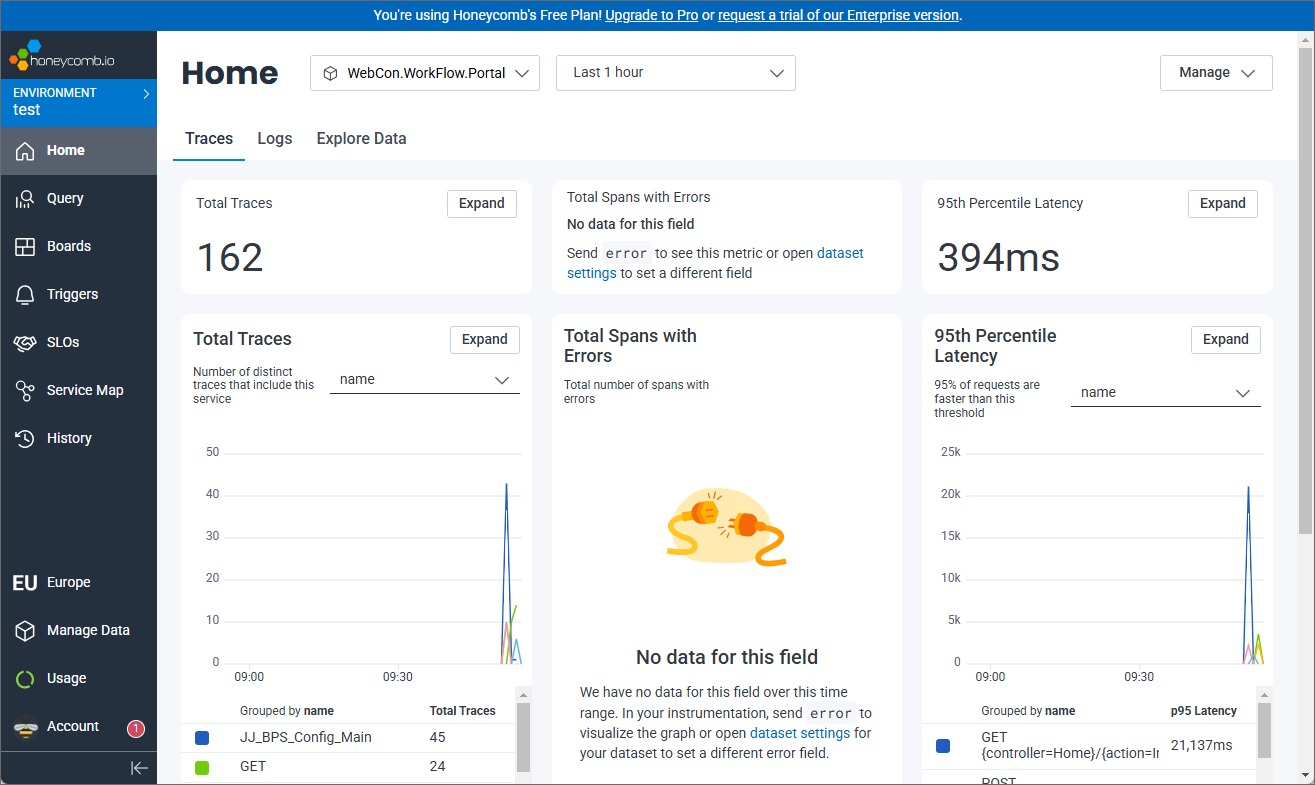
Main page of the Honeycomb tool receiving data from the WEBCON BPS platform
It is worth noting that you can also use other tools for managing traces. Below are example configurations for Azure Monitor / Application Insights, AWS environments, and Google Cloud (using standard OTLP export), as well as for Jaeger (tracing) and Prometheus with the related Grafana platform used for monitoring and analyzing metrics.
- Azure Monitor / Application Insights
To send telemetry to Application Insights, add the ApplicationInsights section with a ConnectionString to appsettings.json. Setting the ConnectionString alone causes telemetry to be sent to Application Insights regardless of the switches under the OpenTelemetry section.
- AWS
Export to AWS environments is handled via standard OTLP exporters by sending data to an AWS collector. If tracing or metrics are enabled, the instrumentation required for AWS is enabled automatically.
- Google Cloud
In the current configuration, we do not support a dedicated section with ProjectId. Instead, we recommend using a Google collector that supports OTLP export (e.g., Ops Agent/OTLP).
- Jaeger
Jaeger is used for monitoring and analyzing queries paths in distributed systems. It is a free software available for downloading at https://www.jaegertracing.io/download/.
Click the link, select the software version corresponding with your operating system, and download the file. Unpack its content to the “C:Jaeger” directory (create the folder if necessary).
Next, open the appsettings.json file and navigate to OpenTelemetry → Tracing → Exporters node. Add (or enable) the Jaeger exporter by setting: Enabled=true, Endpoint=http://localhost:4318/v1/traces, Protocol=http.
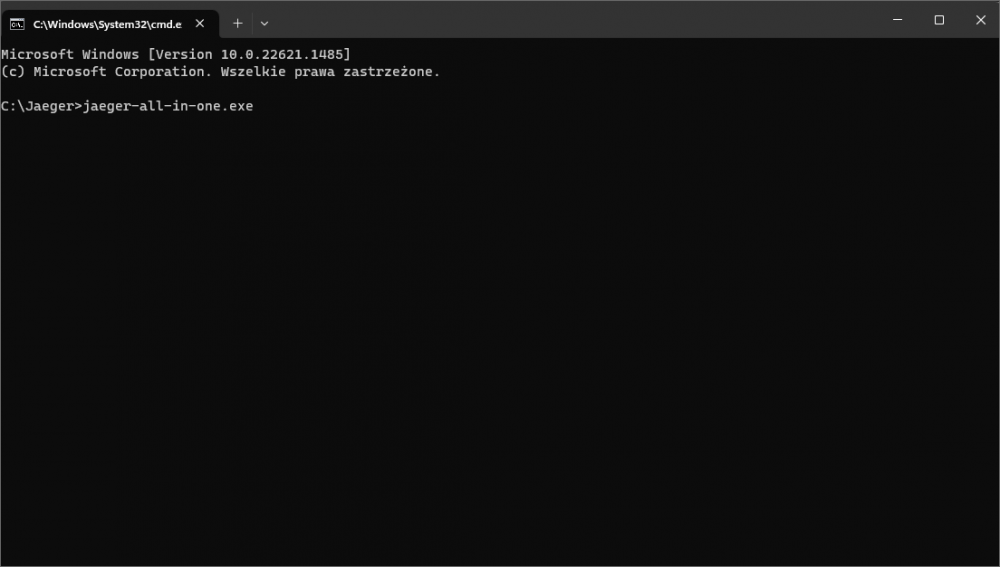
After saving the changes in the file, go to the “C:Jaeger” directory where the tool is installed, and open the Windows console by entering “cmd” command in the address bar. Enter jaeger-all-in-one.exe in the console window.
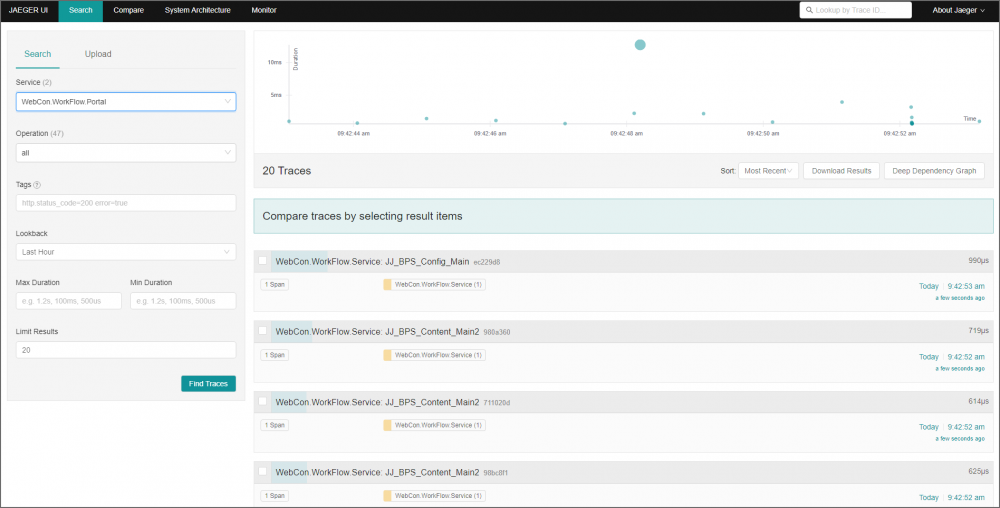
Once the file is opened, you can check the Jaeger platform status by copying the http://localhost:16686/ address and pasting it into the Internet browser.
- Prometheus
The principal task of the Prometheus tool is collecting, storing, and analyzing metrics regarding performance, status, and other parameters of system and applications. To start using the tool, in the appsettings.json file set the Enabled parameter value to “true” in the Metrics and Prometheus nodes.
Next, download the tool. To do that, click the https://prometheus.io/download/ link, and download the file that corresponds to your operating system. Once downloaded, extract its content to “C:Prometheus” (create the folder if it does not exist). In the folder, find and open the prometheus.yml file (again you can do that using the Notepad application or a code editor, e.g. Notepad++), and add a section containing the Portal address and port in accordance with the template below.
- bpsportal: "dev18.webcon.pl:48439"
scheme: https - bpsservice: "localhost:9464"
the scheme is not required
Remember to maintain correct indentation and use only spaces as whitespaces.
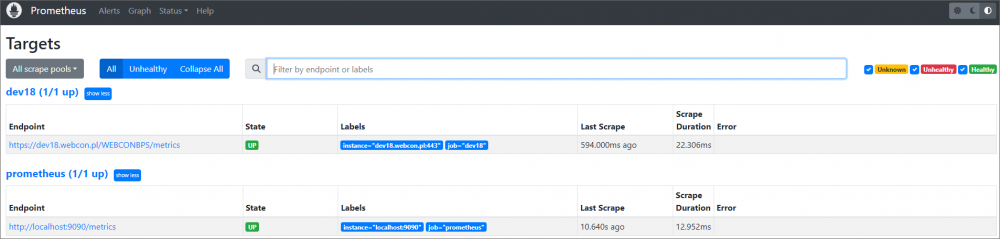
After saving the file, you can check the tool’s status. To do that, go to the Prometheus tool directory (C:Prometheus) and enter the “cmd” command in the address bar. Enter “prometheus.exe” in the Windows console. After running the tool, copy http://localhost:9090/targets and paste it in the Internet browser window. The window shown in the screenshot below is displayed.
- Grafana
The last step consists of configuring Grafana – a tool used for visualizing and monitoring metrics by means of interactive and dynamic navigation screens (the so-called dashboards).
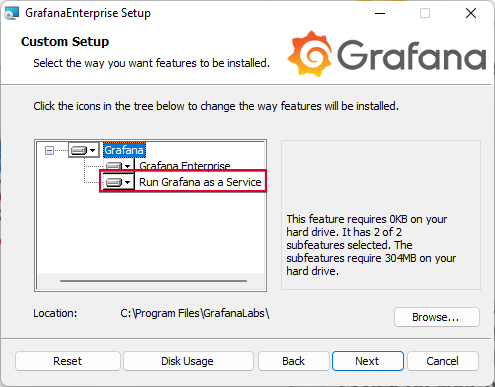
The tool’s installer is available for downloading at https://grafana.com/grafana/download?pg=get&plcmt=selfmanaged-box1-cta1&platform=windows. Following the download, install the software ensuring that the Run Grafana as a service component is selected.
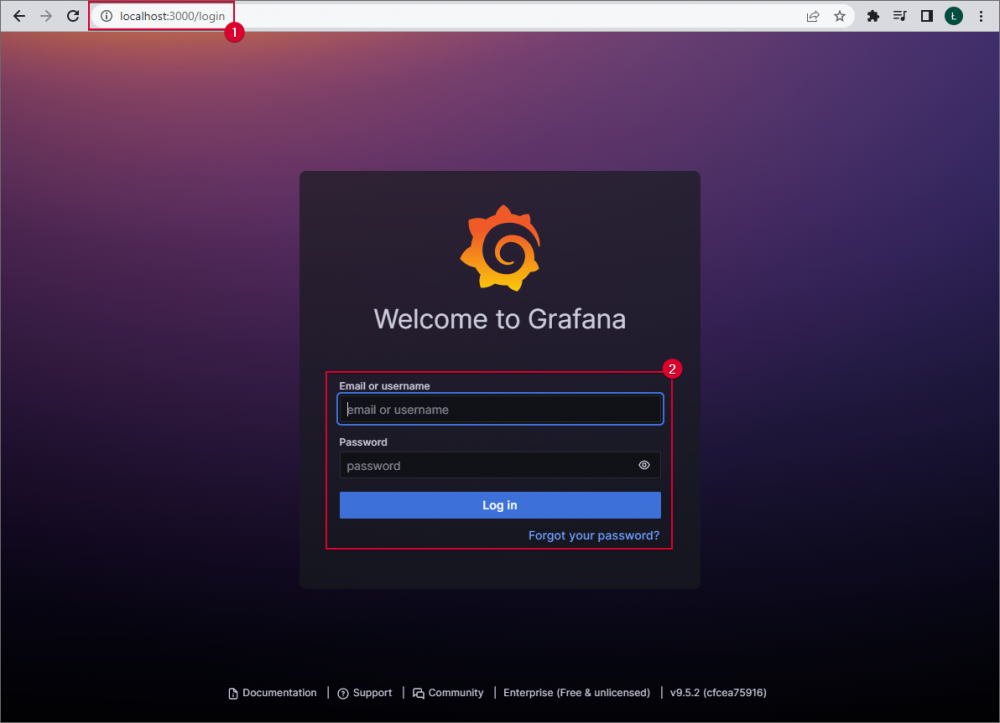
When the installation is completed, open the Internet browser and paste http://localhost:3000/ in the address bar. The Grafana tool log-in website is displayed. The default user name and password is “admin” (you can change the password after logging in).
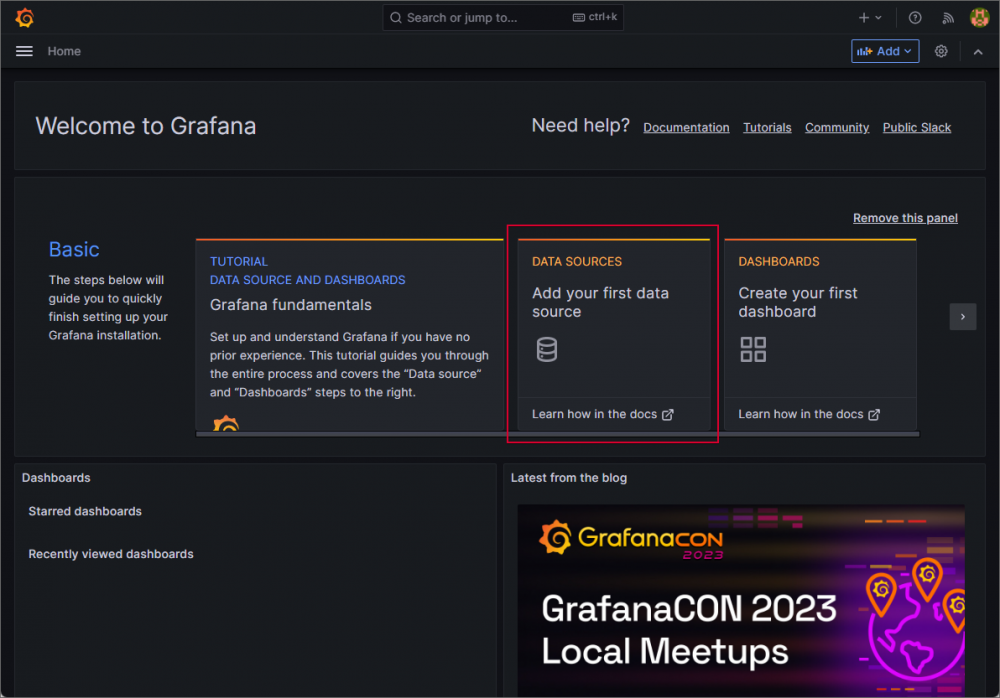
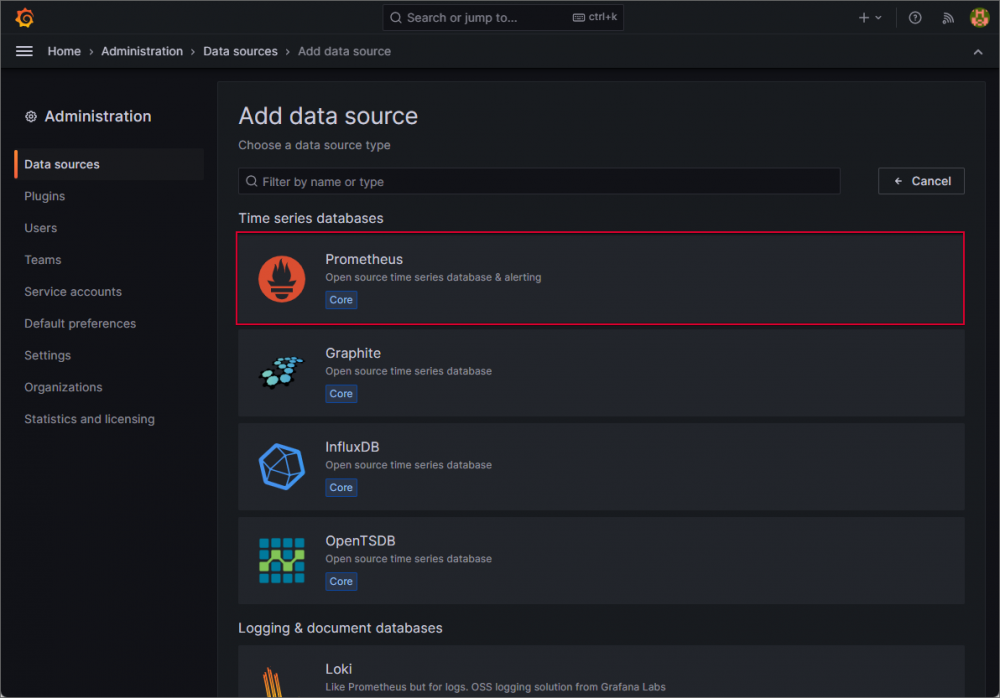
Add a data source to enable the tool to visualize and monitor data. To do that click the DATA SOURCE tile located in the tool’s main window.
Select the Prometheus option from the list of available data sources in the newly opened window.
In the Prometheus data source configuration window enter URL address of the Prometheus server (e.g. http://localhost:9090/). The remaining settings are optional and can be modified by the user based on their preferences.
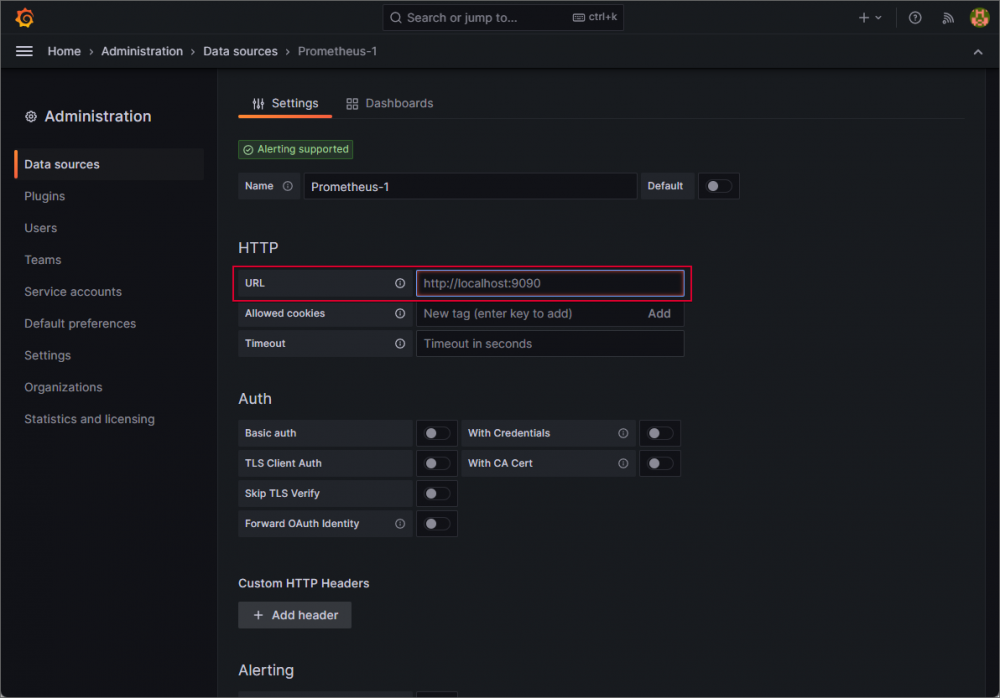
After entering all changes, click the Save & test button located at the bottom. A correctly configured data source allows the tool to create diagrams and generate dashboards.

Available metrics
By configuring the ProcessInstrumentation and WebInstrumentation modules, a user has access to metrics provided by an environment or the ASP.NET platform.
For the ProcessInstrumentation module, you can obtain metrics, such as memory usage, disk operations, network operations, number of threads, or CPU load.
Finally, the WebInstrumentation module allows you to monitor and analyze:
- HTTP requests (e.g. response time, number of requests handled per second, HTTP response code),
- requests flow (how requests are transferred through various layers of applications, what operations are executed within them, and what are response times for individual components),
- context propagation (the ability to track the flow of information and measure performance even for requests that transit through a number of services and components).
In addition, WEBCON BPS provides a set of its own metrics and measures which can be applied to monitor the system. The table below contains the aforementioned measures along with a brief description.
|
Module’s name |
Description |
|
webcon-workflow-form-path-transitions |
The number of path transitions. The counter includes each started transition (regardless of whether it resulted in a positive or negative outcome). |
|
webcon-workflow-form-success-path-transitions |
The number of positively completed path transitions (transitions that ended up with an error are not included). |
|
webcon-workflow-form-open |
The number of form openings. |
|
webcon-workflow-form-elements-cache |
The number of instances currently in the cache. Instances are added to the cache on form opening and are removed from it when transiting a path. |
|
webcon-workflow-form-path-transitions-in-progress |
The number of currently ongoing path transitions. For a correctly operating system, the value should not be too big (a correct path transition can last up to several milliseconds). The measure can increase when the system load is significant (multiple simultaneous path transitions). |
|
webcon-workflow-form-paths-transition-times |
A histogram of path transitions times. |
|
webcon-workflow-portal-open |
The number of Portal openings. (The counter includes each instance of Portal opening in a new browser window). |
Summary
The above-described OpenTelemetry configuration allows you to quickly start monitoring and analyzing data from the WEBCON BPS system and the systems integrated with it. Thanks to this, the system administrator receives a useful tool that provides insight into data that are often not available in other ways, and thus is able to enhance and develop their own system.
+48 12 443 13 90